In May 2024, 33839, FL homes were selling for an average price of $321,518, 33839, FL homes on average sell after 50 days on the market compared to 58 days last year. There were 279 homes sold in 33839, FL for May 2024, compared to 90 last year.
The average list price of 33839, FL, was $344,825 in May 2024, compared to $322,939 in May 2023.
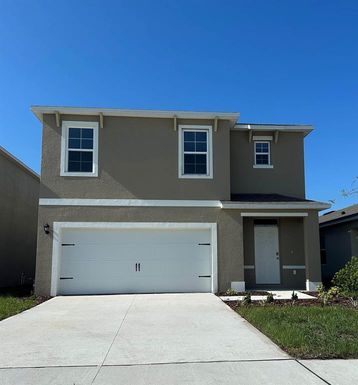
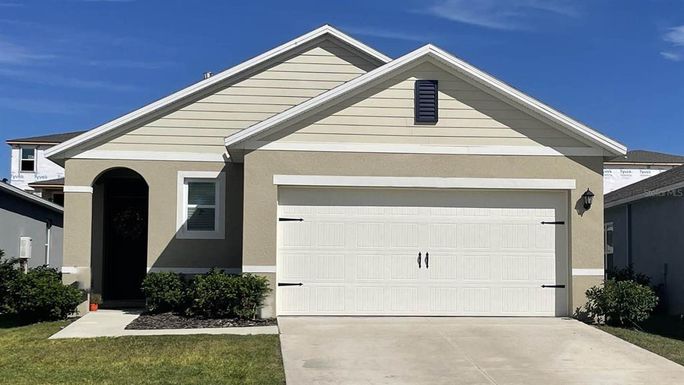
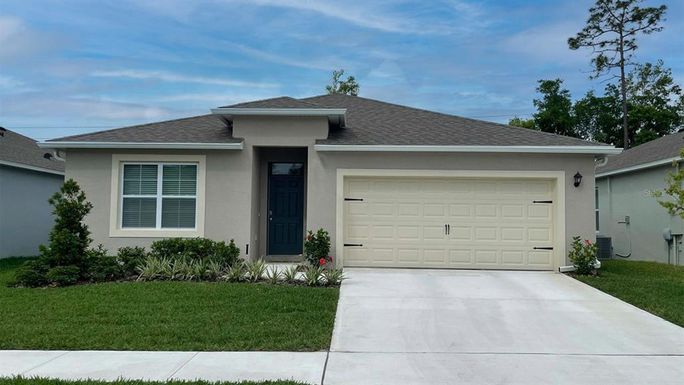
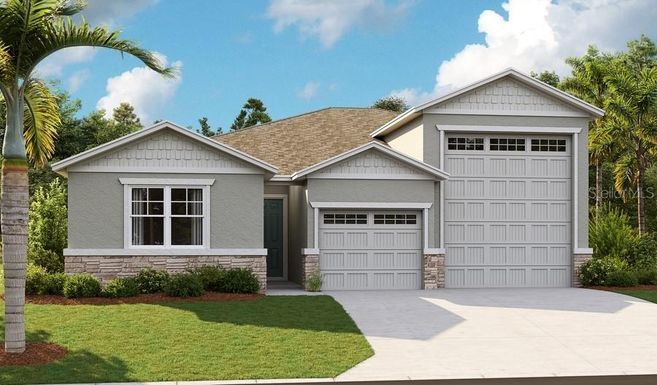
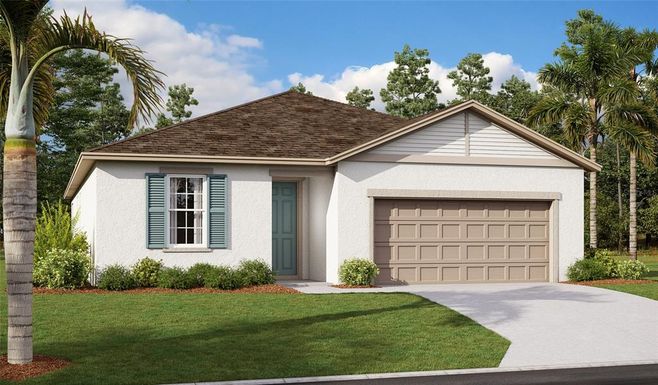
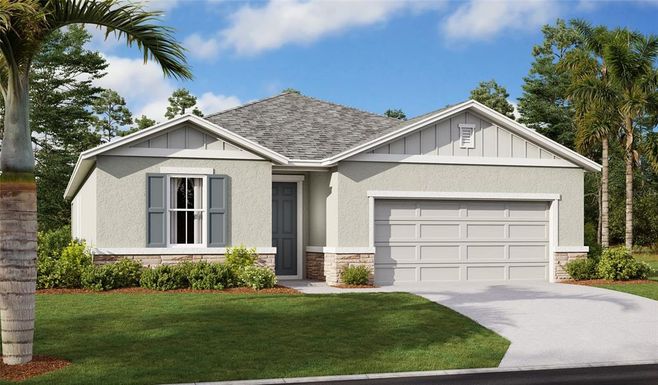
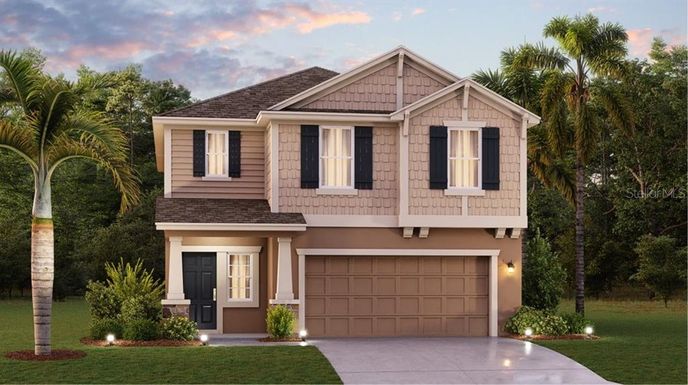
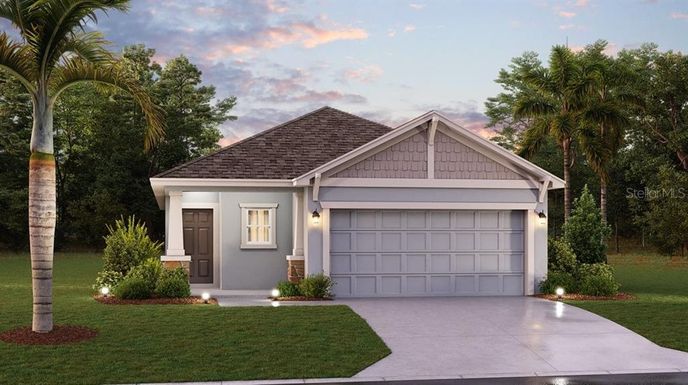
33839, FL Market Trend for Houses
Average List Price
The average list price of houses in 33839, FL, was $339,397 in May 2024, compared to $321,863 in May 2023.
33839, FL Market Trend for Condos / Townhouses / Penthouses
Average List Price
The average list price of condos/co-ops in 33839, FL, was $0 in May 2024, compared to $0 in May 2023.
33839, FL Market Trend for Lots/Land
Average List Price
The average list price of lots/land in 33839, FL, was $354,500 in May 2024, compared to $0 in May 2023.
33839, FL Market Trend for Commercial
Average List Price
The average list price of commercial in 33839, FL, was $700,000 in May 2024, compared to $380,000 in May 2023.
33839, FL Housing Market Analysis
The average list price in 33839, FL is $344,825. The average list price in 33839, FL went up 7.12% from 2023 to 2024. 33839, FL home resale inventories is 72, which increased 38.46% since 2023. The average list price per square foot in 33839, FL is $176. 2023 it was $174.