In May 2024, 33823, FL homes were selling for an average price of $340,889, 33823, FL homes on average sell after 66 days on the market compared to 48 days last year. There were 672 homes sold in 33823, FL for May 2024, compared to 830 last year.
The average list price of 33823, FL, was $401,925 in May 2024, compared to $381,474 in May 2023.
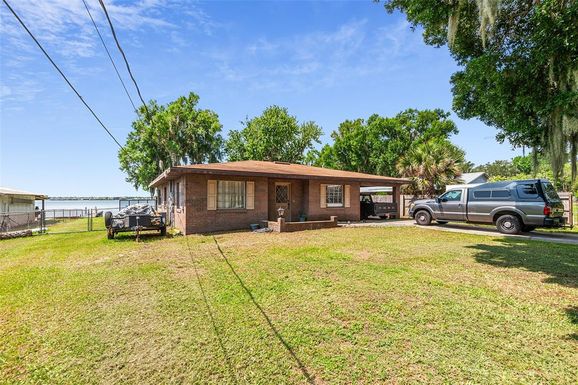
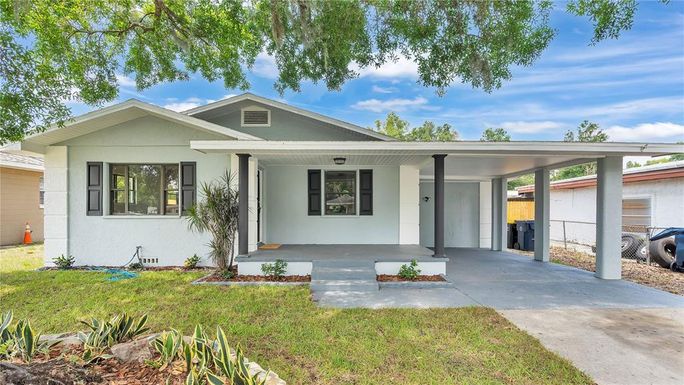
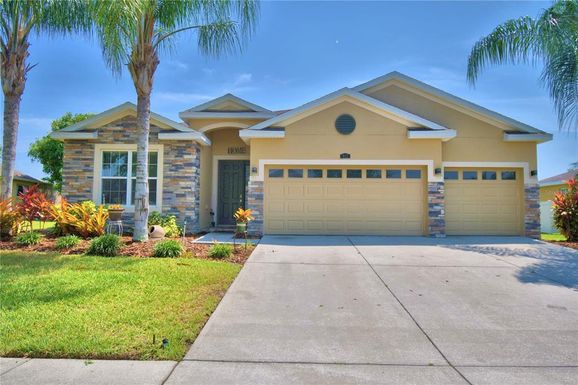
33823, FL Market Trend for Houses
Average List Price
The average list price of houses in 33823, FL, was $425,003 in May 2024, compared to $399,450 in May 2023.
33823, FL Market Trend for Condos / Townhouses / Penthouses
Average List Price
The average list price of condos/co-ops in 33823, FL, was $0 in May 2024, compared to $0 in May 2023.
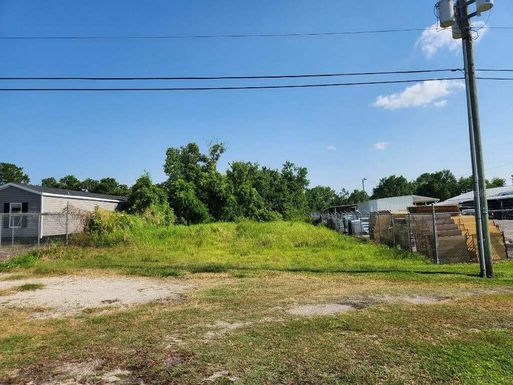
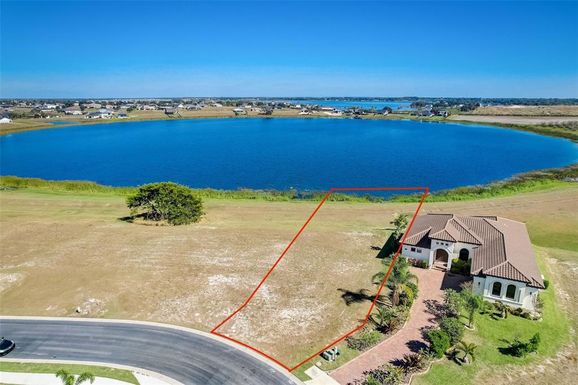
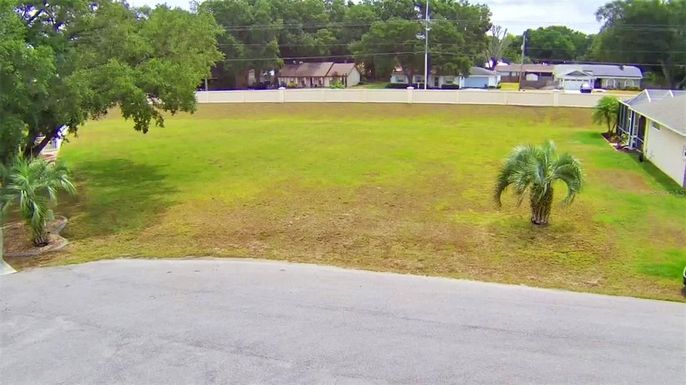
33823, FL Market Trend for Lots/Land
Average List Price
The average list price of lots/land in 33823, FL, was $212,929 in May 2024, compared to $191,736 in May 2023.
33823, FL Market Trend for Commercial
Average List Price
The average list price of commercial in 33823, FL, was $837,237 in May 2024, compared to $914,156 in May 2023.
33823, FL Housing Market Analysis
The average list price in 33823, FL is $401,925. The average list price in 33823, FL went up 4.87% from 2023 to 2024. 33823, FL home resale inventories is 286, which increased 25.99% since 2023. The average list price per square foot in 33823, FL is $219. 2023 it was $210.