In May 2024, 33483, FL homes were selling for an average price of $2,366,657, 33483, FL homes on average sell after 106 days on the market compared to 81 days last year. There were 562 homes sold in 33483, FL for May 2024, compared to 490 last year.
The average list price of 33483, FL, was $3,194,977 in May 2024, compared to $3,323,361 in May 2023.
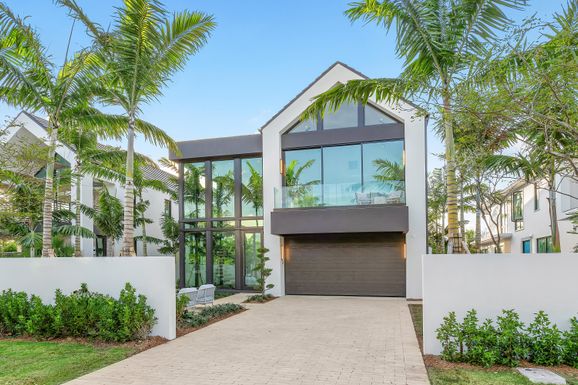
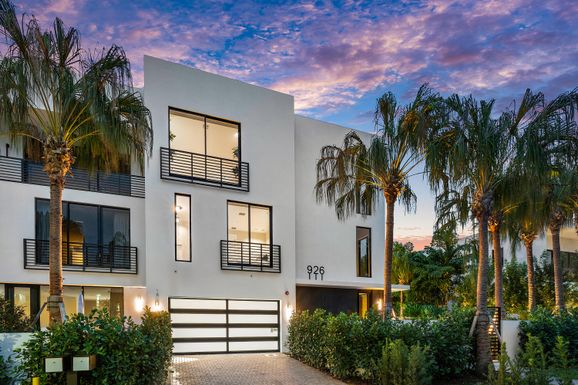
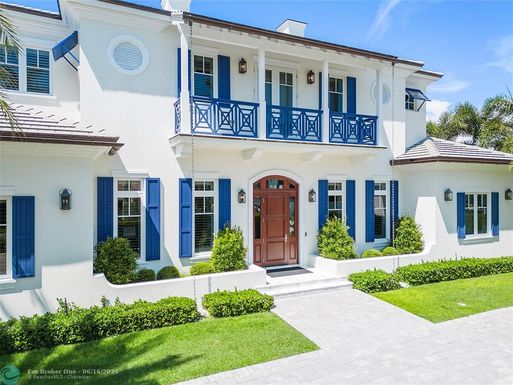
33483, FL Market Trend for Houses
Average List Price
The average list price of houses in 33483, FL, was $7,151,308 in May 2024, compared to $5,643,891 in May 2023.
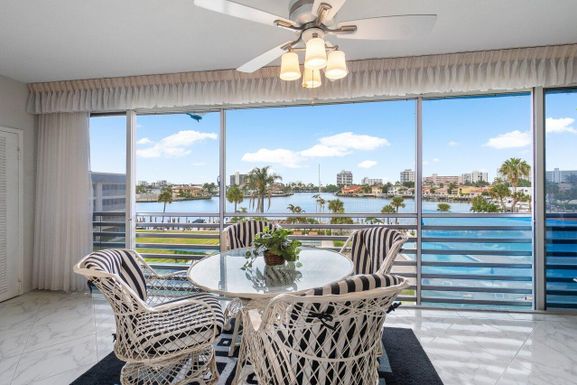
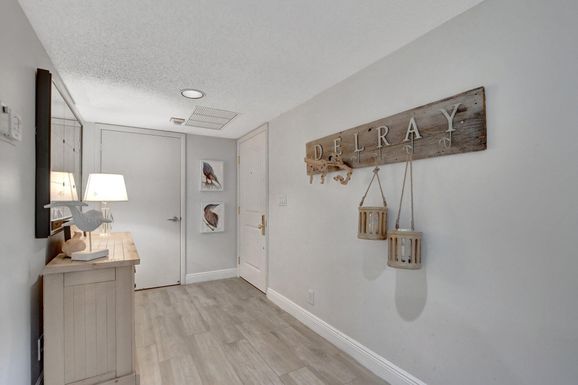
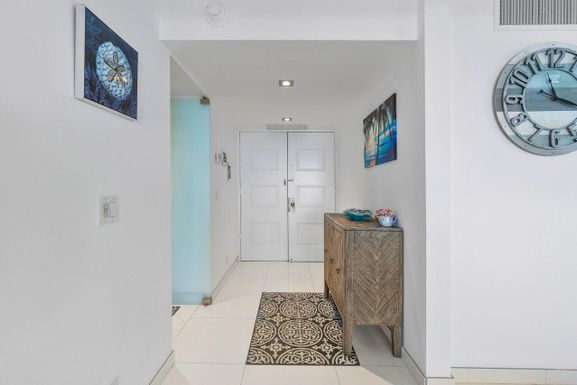
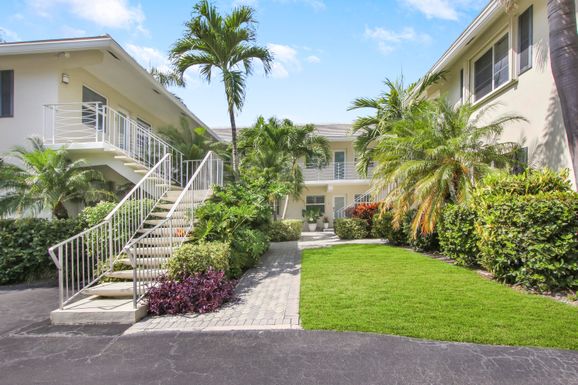
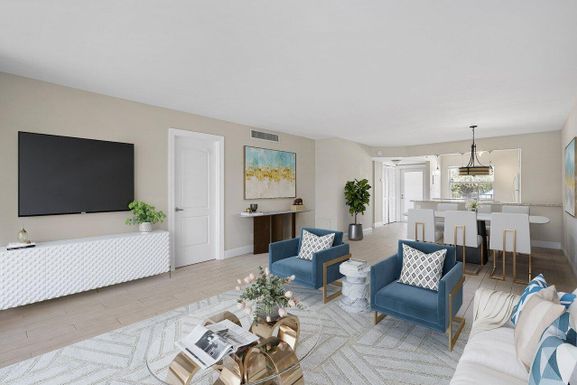
33483, FL Market Trend for Condos / Townhouses / Penthouses
Average List Price
The average list price of condos/co-ops in 33483, FL, was $1,625,113 in May 2024, compared to $1,793,380 in May 2023.
33483, FL Market Trend for Lots/Land
Average List Price
The average list price of lots/land in 33483, FL, was $789,000 in May 2024, compared to $1,450,000 in May 2023.
33483, FL Market Trend for Commercial
Average List Price
The average list price of commercial in 33483, FL, was $2,771,882 in May 2024, compared to $4,152,679 in May 2023.
33483, FL Housing Market Analysis
The average list price in 33483, FL is $3,194,977. The average list price in 33483, FL went up 5.26% from 2023 to 2024. 33483, FL home resale inventories is 284, which increased 45.64% since 2023. The average list price per square foot in 33483, FL is $953. 2023 it was $919.