In May 2024, Boynton Beach, FL homes were selling for an average price of $486,699, Boynton Beach, FL homes on average sell after 60 days on the market compared to 41 days last year. There were 4380 homes sold in Boynton Beach, FL for May 2024, compared to 4223 last year.
The average list price of Boynton Beach, FL, was $502,205 in May 2024, compared to $502,476 in May 2023.
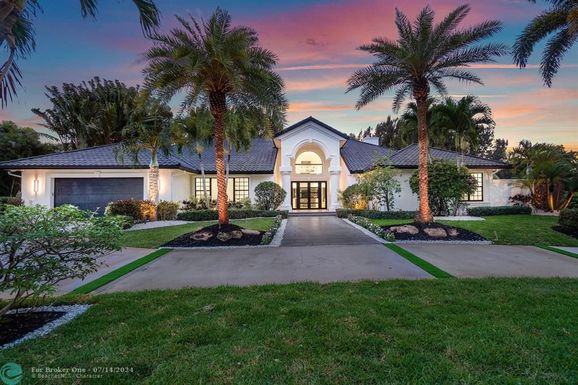
Boynton Beach, FL Market Trend for Houses
Average List Price
The average list price of houses in Boynton Beach, FL, was $620,930 in May 2024, compared to $605,044 in May 2023.
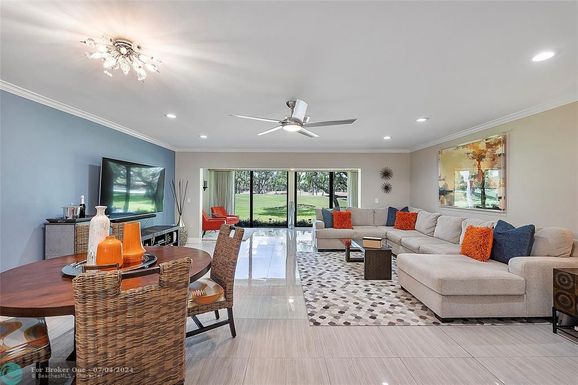
Boynton Beach, FL Market Trend for Condos / Townhouses / Penthouses
Average List Price
The average list price of condos/co-ops in Boynton Beach, FL, was $298,827 in May 2024, compared to $295,859 in May 2023.
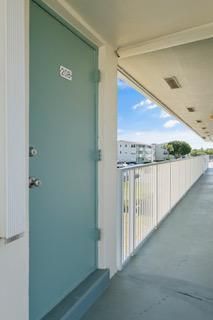
Boynton Beach, FL Market Trend for Lots/Land
Average List Price
The average list price of lots/land in Boynton Beach, FL, was $964,950 in May 2024, compared to $900,000 in May 2023.
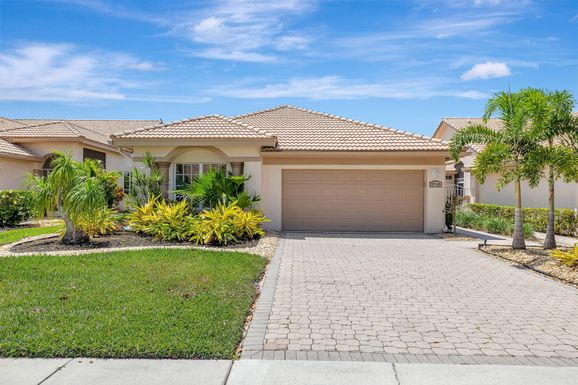
Boynton Beach, FL Market Trend for Commercial
Average List Price
The average list price of commercial in Boynton Beach, FL, was $1,300,863 in May 2024, compared to $1,152,336 in May 2023.
Boynton Beach, FL Housing Market Analysis
The average list price in Boynton Beach, FL is $502,205. The average list price in Boynton Beach, FL went down 2.29% from 2023 to 2024. Boynton Beach, FL home resale inventories is 1397, which increased 30.20% since 2023. The average list price per square foot in Boynton Beach, FL is $269. 2023 it was $270.