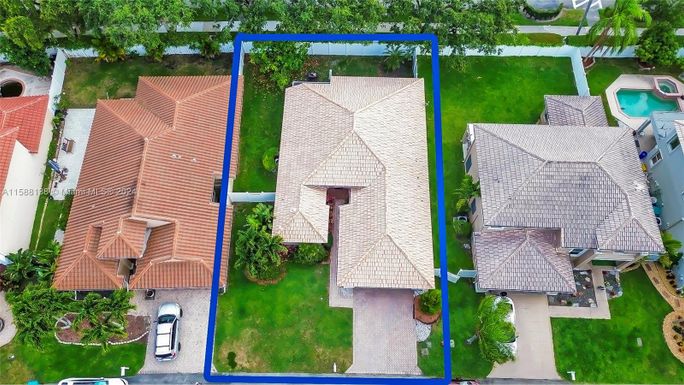
In May 2024, 33436, FL homes were selling for an average price of $490,175, 33436, FL homes on average sell after 58 days on the market compared to 41 days last year. There were 1027 homes sold in 33436, FL for May 2024, compared to 1004 last year.
The average list price of 33436, FL, was $435,431 in May 2024, compared to $486,853 in May 2023.
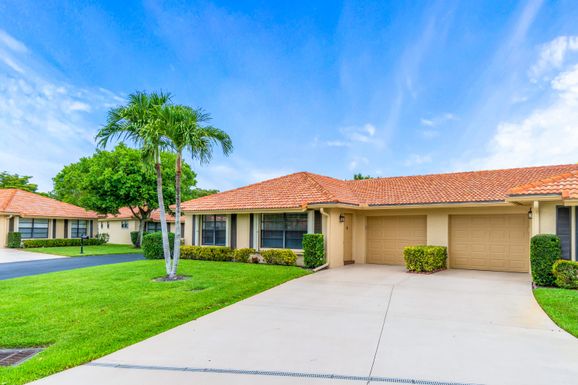
33436, FL Market Trend for Houses
Average List Price
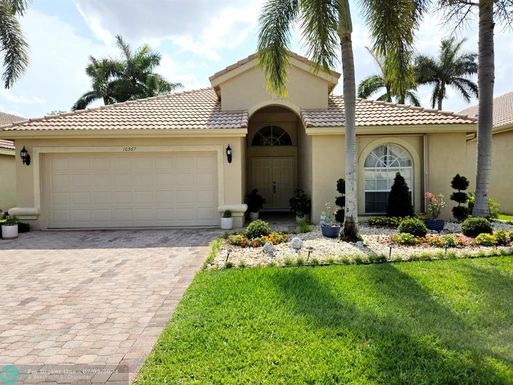
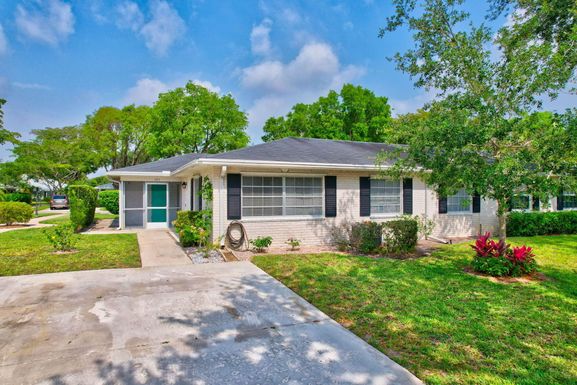
The average list price of houses in 33436, FL, was $545,950 in May 2024, compared to $584,066 in May 2023.
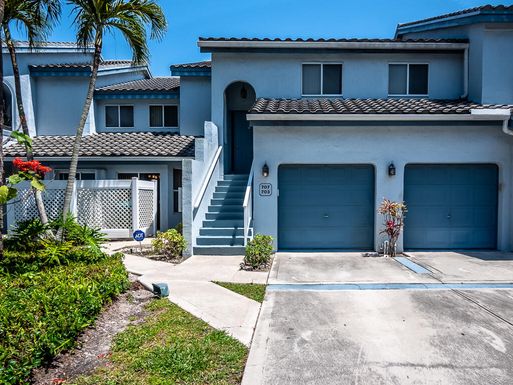
33436, FL Market Trend for Condos / Townhouses / Penthouses
Average List Price
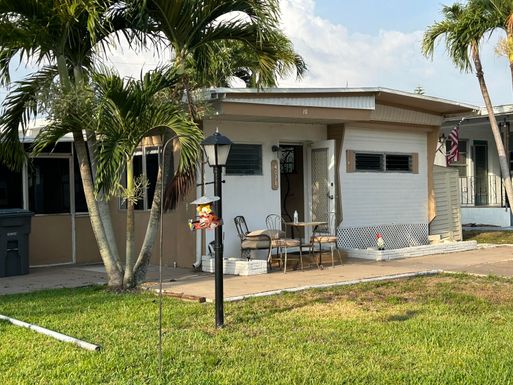
The average list price of condos/co-ops in 33436, FL, was $240,221 in May 2024, compared to $290,888 in May 2023.
33436, FL Market Trend for Lots/Land
Average List Price
The average list price of lots/land in 33436, FL, was $1,500,000 in May 2024, compared to $0 in May 2023.
33436, FL Market Trend for Commercial
Average List Price
The average list price of commercial in 33436, FL, was $937,067 in May 2024, compared to $598,333 in May 2023.
33436, FL Housing Market Analysis
The average list price in 33436, FL is $435,431. The average list price in 33436, FL went down 10.88% from 2023 to 2024. 33436, FL home resale inventories is 378, which increased 53.66% since 2023. The average list price per square foot in 33436, FL is $223. 2023 it was $247.