In May 2024, 32839, FL homes were selling for an average price of $264,775, 32839, FL homes on average sell after 39 days on the market compared to 30 days last year. There were 304 homes sold in 32839, FL for May 2024, compared to 370 last year.
The average list price of 32839, FL, was $272,508 in May 2024, compared to $243,616 in May 2023.
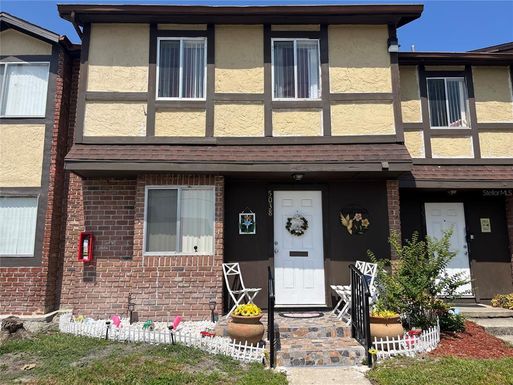
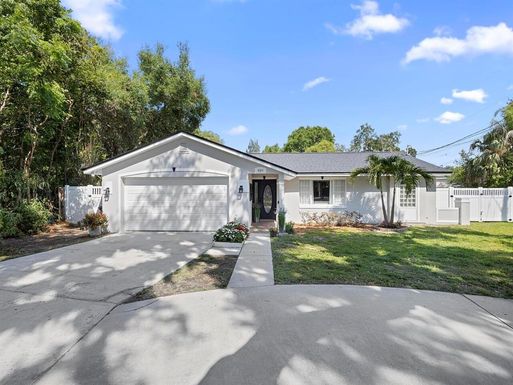
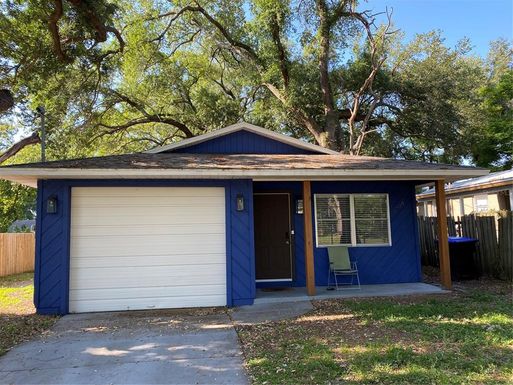
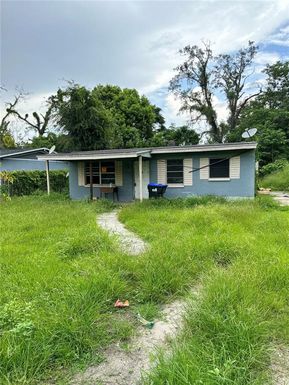
32839, FL Market Trend for Houses
Average List Price
The average list price of houses in 32839, FL, was $520,654 in May 2024, compared to $331,929 in May 2023.
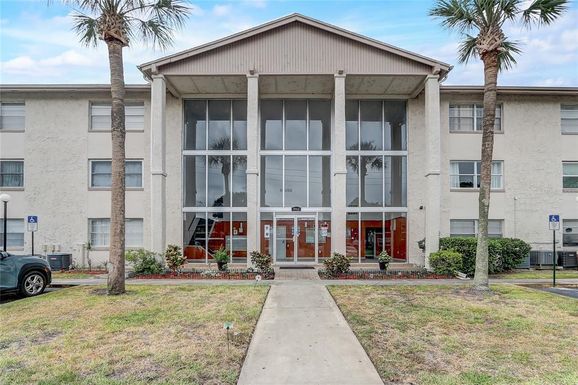
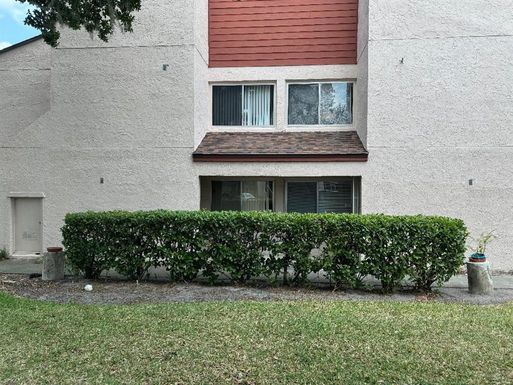
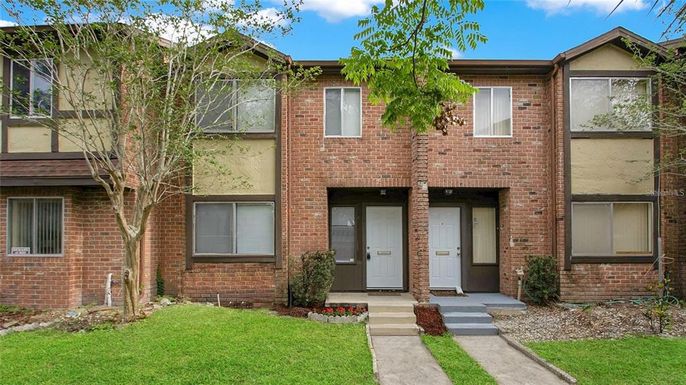
32839, FL Market Trend for Condos / Townhouses / Penthouses
Average List Price
The average list price of condos/co-ops in 32839, FL, was $177,183 in May 2024, compared to $196,215 in May 2023.
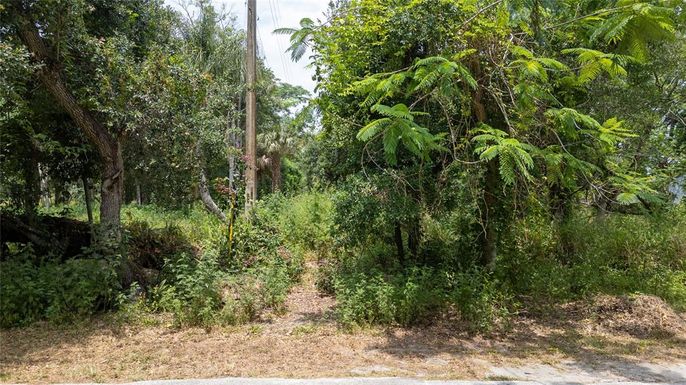
32839, FL Market Trend for Lots/Land
Average List Price
The average list price of lots/land in 32839, FL, was $404,125 in May 2024, compared to $239,250 in May 2023.
32839, FL Market Trend for Commercial
Average List Price
The average list price of commercial in 32839, FL, was $1,039,853 in May 2024, compared to $30,000 in May 2023.
32839, FL Housing Market Analysis
The average list price in 32839, FL is $272,508. The average list price in 32839, FL went down 4.92% from 2023 to 2024. 32839, FL home resale inventories is 134, which increased 106.15% since 2023. The average list price per square foot in 32839, FL is $200. 2023 it was $194.