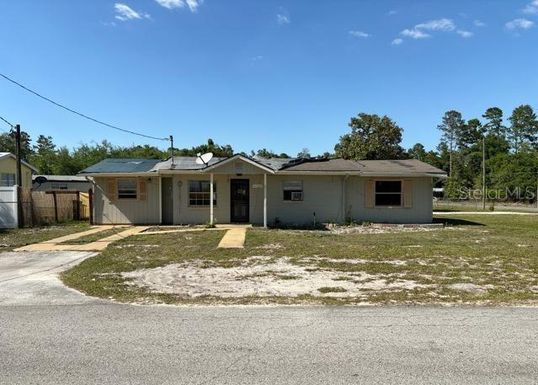
In May 2024, 32767, FL homes were selling for an average price of $119,367, 32767, FL homes on average sell after 97 days on the market compared to 105 days last year. There were 84 homes sold in 32767, FL for May 2024, compared to 92 last year.
The average list price of 32767, FL, was $180,538 in May 2024, compared to $140,828 in May 2023.
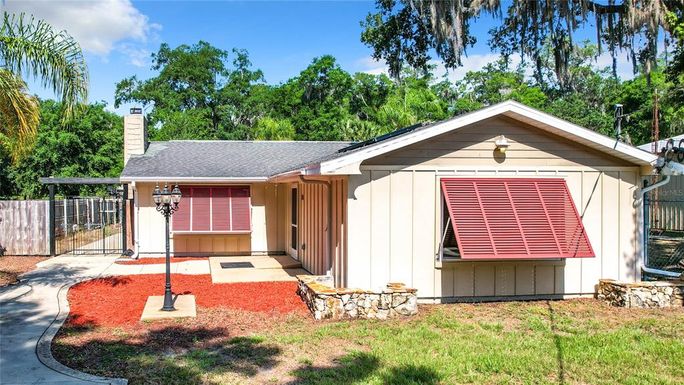
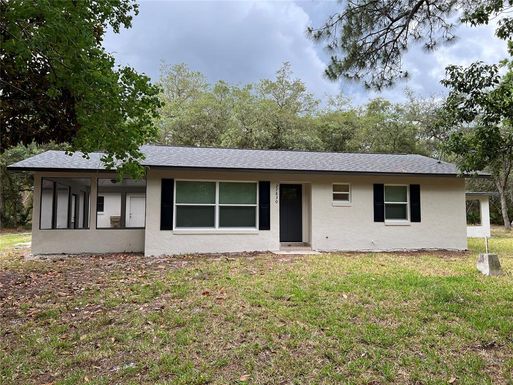
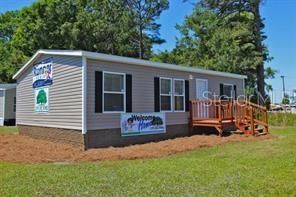
32767, FL Market Trend for Houses
Average List Price
The average list price of houses in 32767, FL, was $410,373 in May 2024, compared to $457,150 in May 2023.
32767, FL Market Trend for Condos / Townhouses / Penthouses
Average List Price
The average list price of condos/co-ops in 32767, FL, was $0 in May 2024, compared to $0 in May 2023.
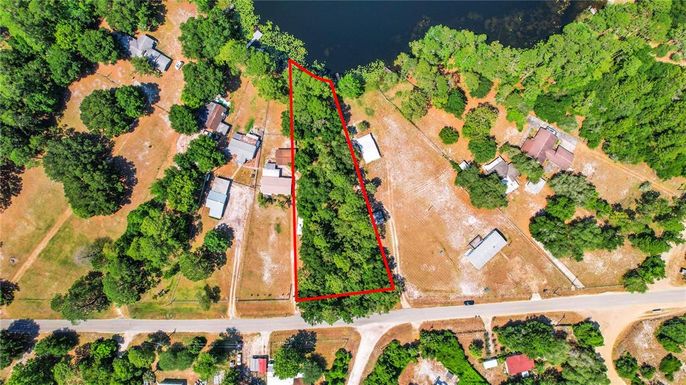
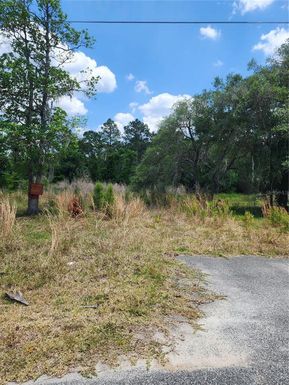
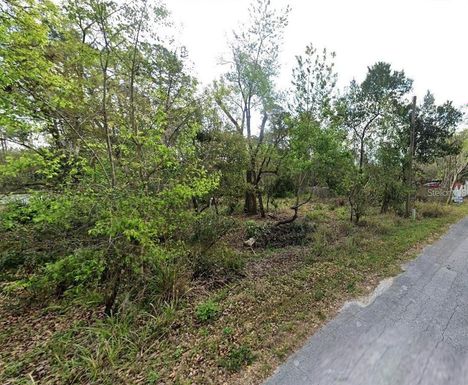
32767, FL Market Trend for Lots/Land
Average List Price
The average list price of lots/land in 32767, FL, was $113,118 in May 2024, compared to $53,325 in May 2023.
32767, FL Market Trend for Commercial
Average List Price
The average list price of commercial in 32767, FL, was $0 in May 2024, compared to $0 in May 2023.
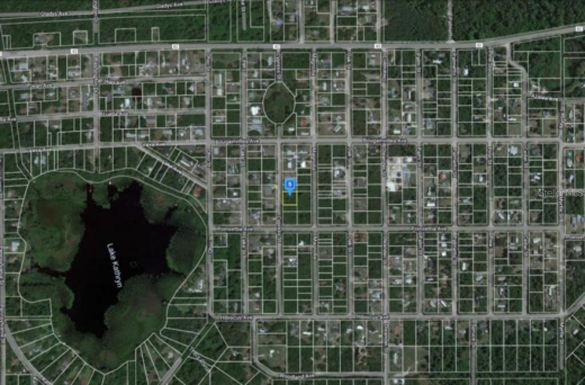
32767, FL Housing Market Analysis
The average list price in 32767, FL is $180,538. The average list price in 32767, FL went up 28.20% from 2023 to 2024. 32767, FL home resale inventories is 55, which increased 27.91% since 2023. The average list price per square foot in 32767, FL is $206. 2023 it was $191.