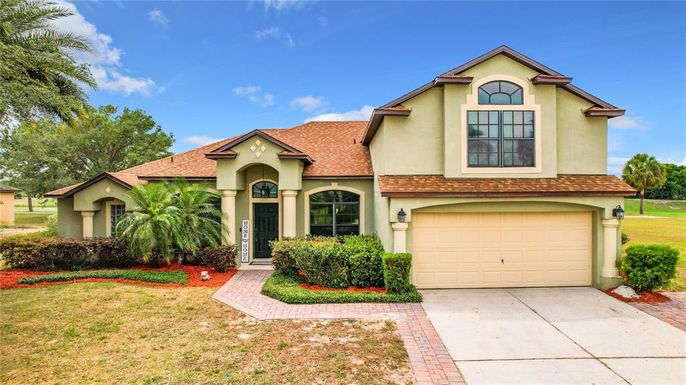
In May 2024, 32736, FL homes were selling for an average price of $398,546, 32736, FL homes on average sell after 70 days on the market compared to 57 days last year. There were 302 homes sold in 32736, FL for May 2024, compared to 274 last year.
The average list price of 32736, FL, was $542,440 in May 2024, compared to $428,788 in May 2023.
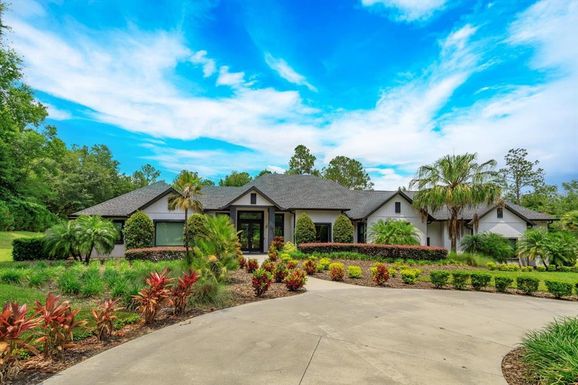
32736, FL Market Trend for Houses
Average List Price
The average list price of houses in 32736, FL, was $734,791 in May 2024, compared to $639,566 in May 2023.
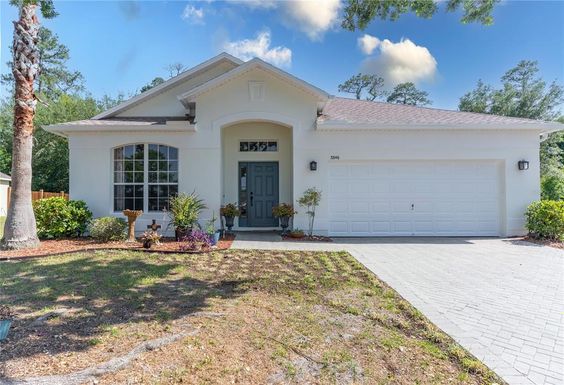
32736, FL Market Trend for Condos / Townhouses / Penthouses
Average List Price
The average list price of condos/co-ops in 32736, FL, was $0 in May 2024, compared to $0 in May 2023.
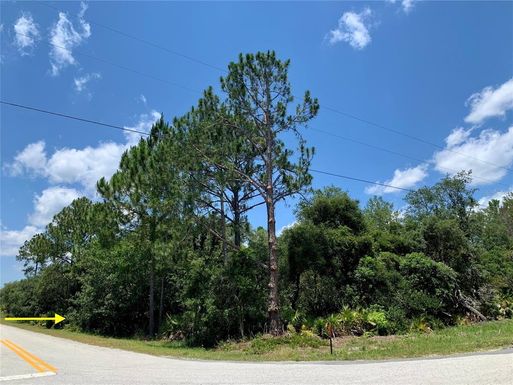
32736, FL Market Trend for Lots/Land
Average List Price
The average list price of lots/land in 32736, FL, was $248,947 in May 2024, compared to $185,421 in May 2023.
32736, FL Market Trend for Commercial
Average List Price
The average list price of commercial in 32736, FL, was $966,950 in May 2024, compared to $33,900 in May 2023.
32736, FL Housing Market Analysis
The average list price in 32736, FL is $542,440. The average list price in 32736, FL went up 27.61% from 2023 to 2024. 32736, FL home resale inventories is 95, which increased 3.26% since 2023. The average list price per square foot in 32736, FL is $243. 2023 it was $224.