In May 2024, 32696, FL homes were selling for an average price of $240,052, 32696, FL homes on average sell after 103 days on the market compared to 100 days last year. There were 352 homes sold in 32696, FL for May 2024, compared to 434 last year.
The average list price of 32696, FL, was $267,747 in May 2024, compared to $259,115 in May 2023.
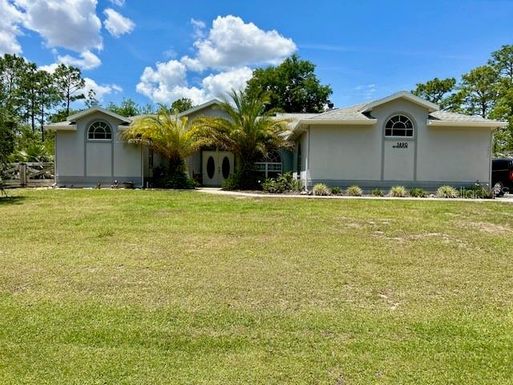
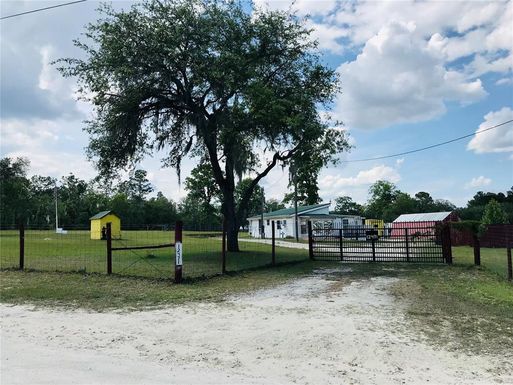
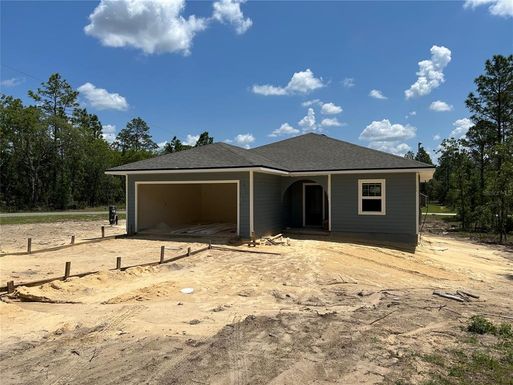
32696, FL Market Trend for Houses
Average List Price
The average list price of houses in 32696, FL, was $447,590 in May 2024, compared to $454,852 in May 2023.
32696, FL Market Trend for Condos / Townhouses / Penthouses
Average List Price
The average list price of condos/co-ops in 32696, FL, was $0 in May 2024, compared to $0 in May 2023.
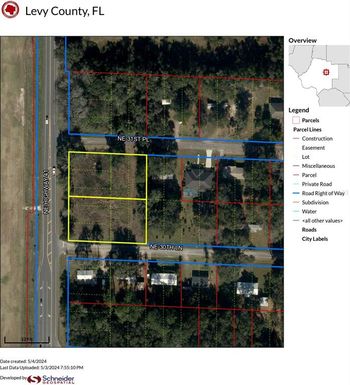
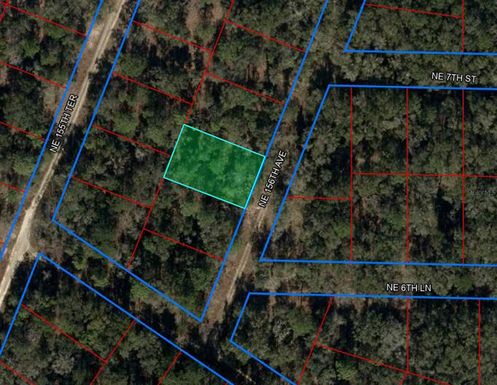
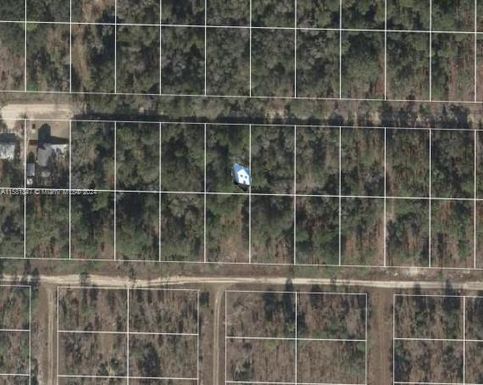
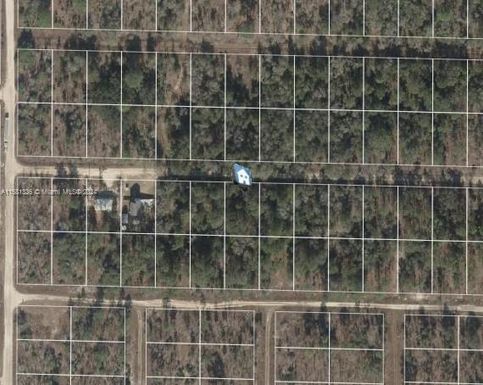
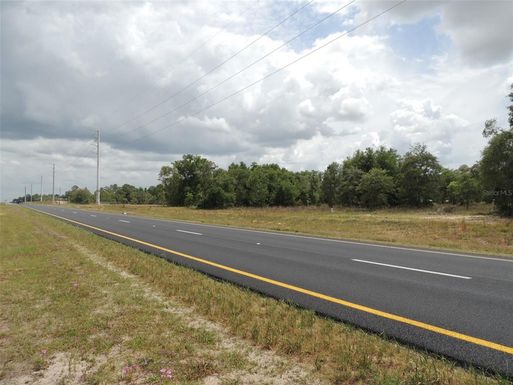
32696, FL Market Trend for Lots/Land
Average List Price
The average list price of lots/land in 32696, FL, was $89,436 in May 2024, compared to $105,383 in May 2023.
32696, FL Market Trend for Commercial
Average List Price
The average list price of commercial in 32696, FL, was $560,200 in May 2024, compared to $983,775 in May 2023.
32696, FL Housing Market Analysis
The average list price in 32696, FL is $267,747. The average list price in 32696, FL went down 0.34% from 2023 to 2024. 32696, FL home resale inventories is 187, which increased 15.43% since 2023. The average list price per square foot in 32696, FL is $333. 2023 it was $276.