In May 2024, Pompano Beach, FL homes were selling for an average price of $534,284, Pompano Beach, FL homes on average sell after 63 days on the market compared to 42 days last year. There were 2221 homes sold in Pompano Beach, FL for May 2024, compared to 2305 last year.
The average list price of Pompano Beach, FL, was $827,938 in May 2024, compared to $676,953 in May 2023.
Pompano Beach, FL Market Trend for Houses
Average List Price
The average list price of houses in Pompano Beach, FL, was $1,289,274 in May 2024, compared to $902,441 in May 2023.
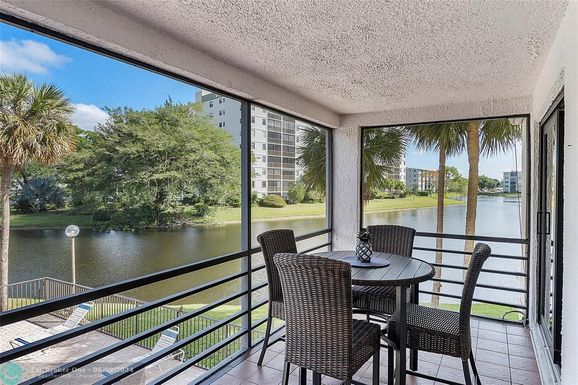
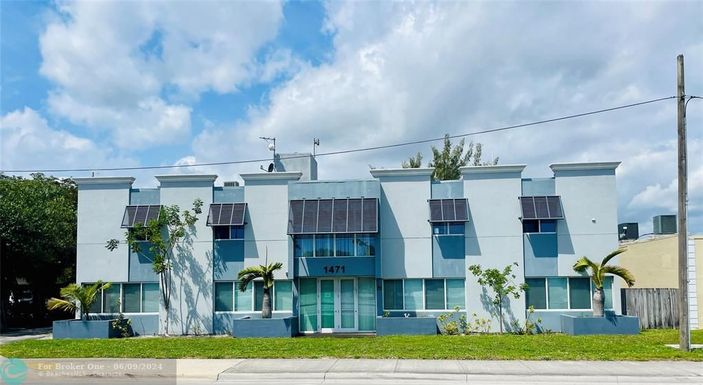
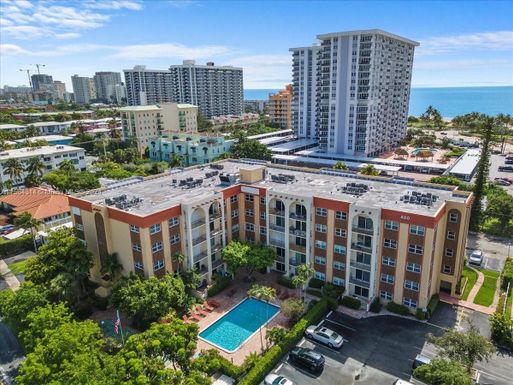
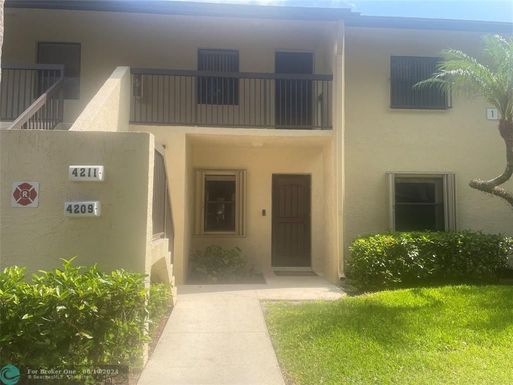
Pompano Beach, FL Market Trend for Condos / Townhouses / Penthouses
Average List Price
The average list price of condos/co-ops in Pompano Beach, FL, was $547,297 in May 2024, compared to $449,076 in May 2023.
Pompano Beach, FL Market Trend for Lots/Land
Average List Price
The average list price of lots/land in Pompano Beach, FL, was $1,720,143 in May 2024, compared to $331,880 in May 2023.
Pompano Beach, FL Market Trend for Commercial
Average List Price
The average list price of commercial in Pompano Beach, FL, was $1,669,973 in May 2024, compared to $2,045,753 in May 2023.
Pompano Beach, FL Housing Market Analysis
The average list price in Pompano Beach, FL is $827,938. The average list price in Pompano Beach, FL went up 17.40% from 2023 to 2024. Pompano Beach, FL home resale inventories is 1250, which increased 100.00% since 2023. The average list price per square foot in Pompano Beach, FL is $417. 2023 it was $382.