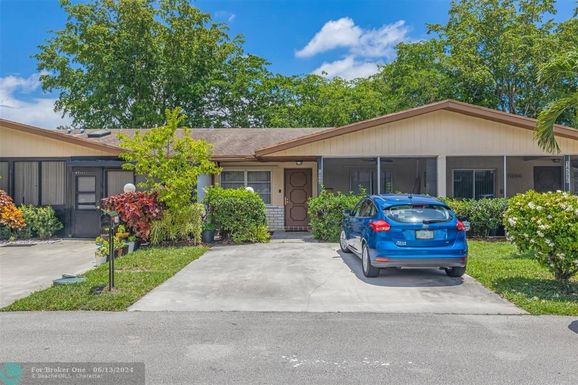
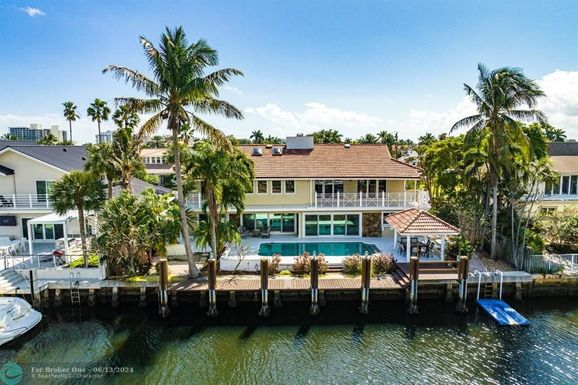
In May 2024, Delray Beach, FL homes were selling for an average price of $816,392, Delray Beach, FL homes on average sell after 71 days on the market compared to 48 days last year. There were 4297 homes sold in Delray Beach, FL for May 2024, compared to 4067 last year.
The average list price of Delray Beach, FL, was $1,055,186 in May 2024, compared to $1,171,844 in May 2023.
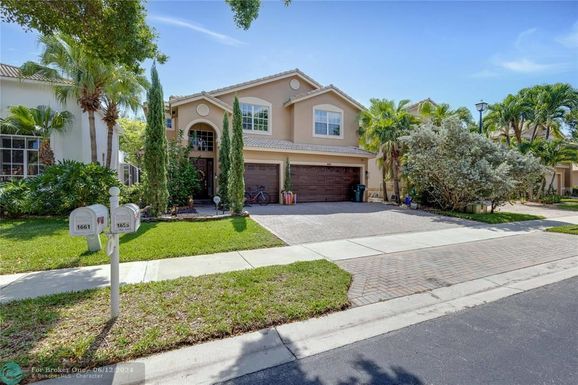
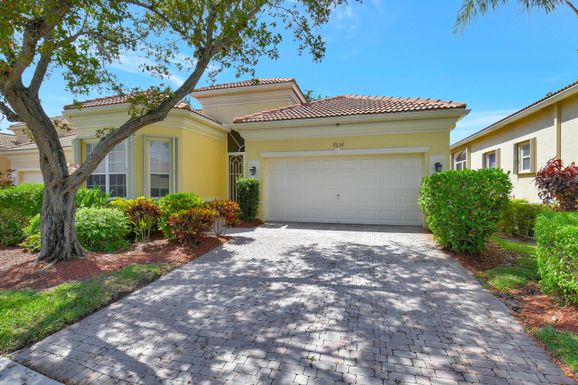
Delray Beach, FL Market Trend for Houses
Average List Price
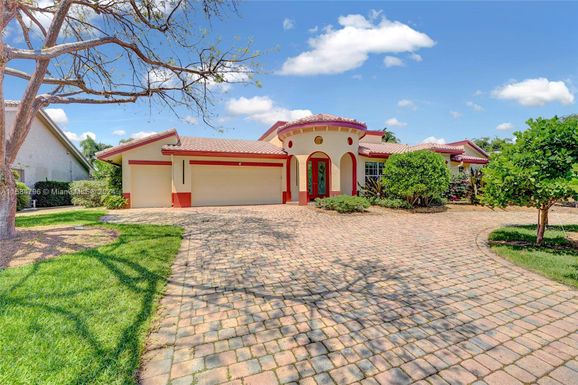
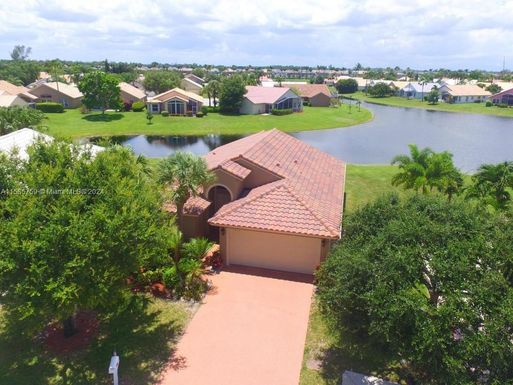
The average list price of houses in Delray Beach, FL, was $1,771,816 in May 2024, compared to $1,608,815 in May 2023.
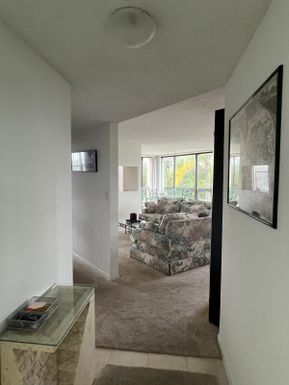
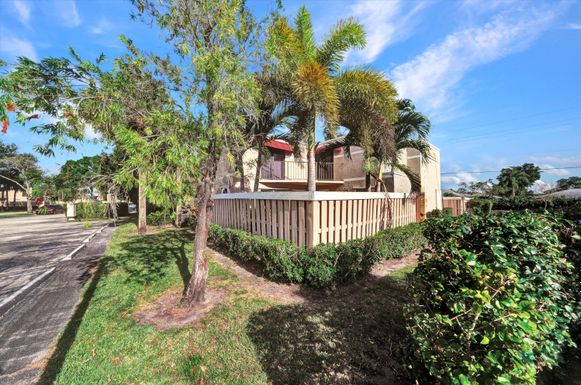
Delray Beach, FL Market Trend for Condos / Townhouses / Penthouses
Average List Price
The average list price of condos/co-ops in Delray Beach, FL, was $455,771 in May 2024, compared to $591,127 in May 2023.
Delray Beach, FL Market Trend for Lots/Land
Average List Price
The average list price of lots/land in Delray Beach, FL, was $470,967 in May 2024, compared to $2,000,000 in May 2023.
Delray Beach, FL Market Trend for Commercial
Average List Price
The average list price of commercial in Delray Beach, FL, was $2,905,162 in May 2024, compared to $3,753,255 in May 2023.
Delray Beach, FL Housing Market Analysis
The average list price in Delray Beach, FL is $1,055,186. The average list price in Delray Beach, FL went down 5.46% from 2023 to 2024. Delray Beach, FL home resale inventories is 1797, which increased 56.53% since 2023. The average list price per square foot in Delray Beach, FL is $404. 2023 it was $411.