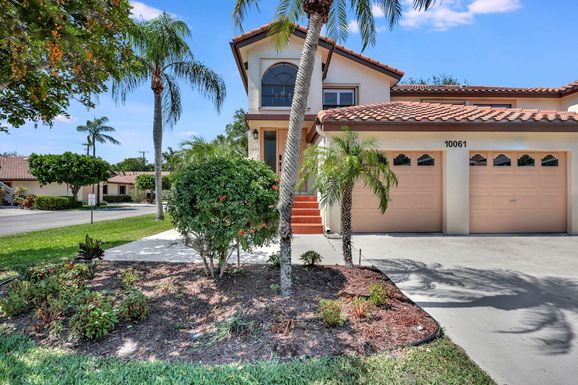
In May 2024, Boynton Beach, FL homes were selling for an average price of $486,586, Boynton Beach, FL homes on average sell after 61 days on the market compared to 42 days last year. There were 4350 homes sold in Boynton Beach, FL for May 2024, compared to 4235 last year.
The average list price of Boynton Beach, FL, was $501,697 in May 2024, compared to $506,314 in May 2023.
Boynton Beach, FL Market Trend for Houses
Average List Price
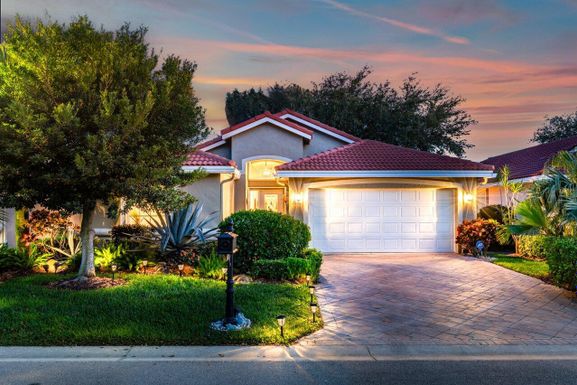
The average list price of houses in Boynton Beach, FL, was $622,193 in May 2024, compared to $614,246 in May 2023.
Boynton Beach, FL Market Trend for Condos / Townhouses / Penthouses
Average List Price
The average list price of condos/co-ops in Boynton Beach, FL, was $294,009 in May 2024, compared to $293,599 in May 2023.
Boynton Beach, FL Market Trend for Lots/Land
Average List Price
The average list price of lots/land in Boynton Beach, FL, was $1,500,000 in May 2024, compared to $900,000 in May 2023.
Boynton Beach, FL Market Trend for Commercial
Average List Price
The average list price of commercial in Boynton Beach, FL, was $1,325,070 in May 2024, compared to $1,094,244 in May 2023.
Boynton Beach, FL Housing Market Analysis
The average list price in Boynton Beach, FL is $501,697. The average list price in Boynton Beach, FL went down 2.73% from 2023 to 2024. Boynton Beach, FL home resale inventories is 1396, which increased 29.74% since 2023. The average list price per square foot in Boynton Beach, FL is $268. 2023 it was $270.