In May 2024, Plant City, FL homes were selling for an average price of $375,959, Plant City, FL homes on average sell after 49 days on the market compared to 51 days last year. There were 1251 homes sold in Plant City, FL for May 2024, compared to 1100 last year.
The average list price of Plant City, FL, was $548,813 in May 2024, compared to $414,210 in May 2023.
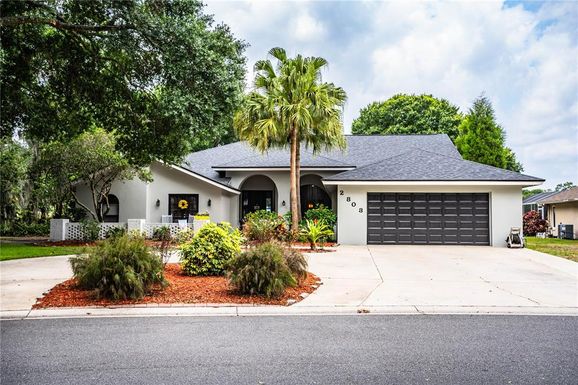
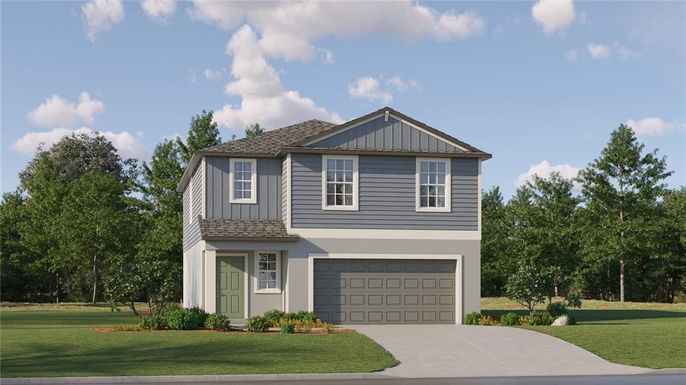
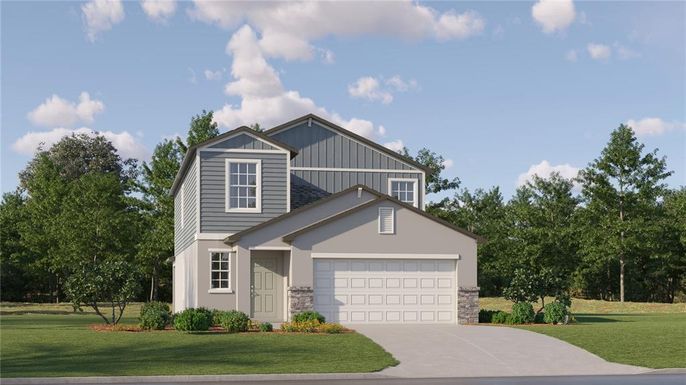
Plant City, FL Market Trend for Houses
Average List Price
The average list price of houses in Plant City, FL, was $490,351 in May 2024, compared to $423,767 in May 2023.
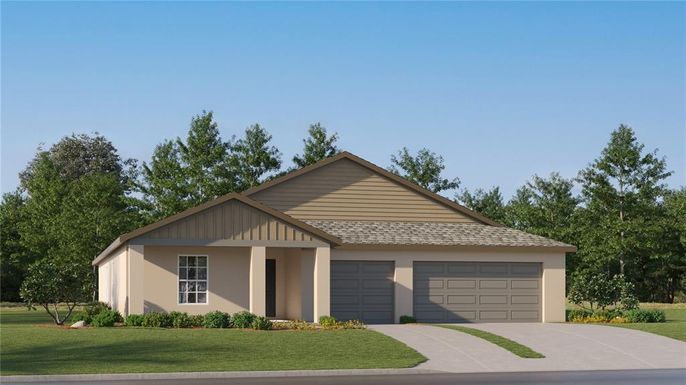
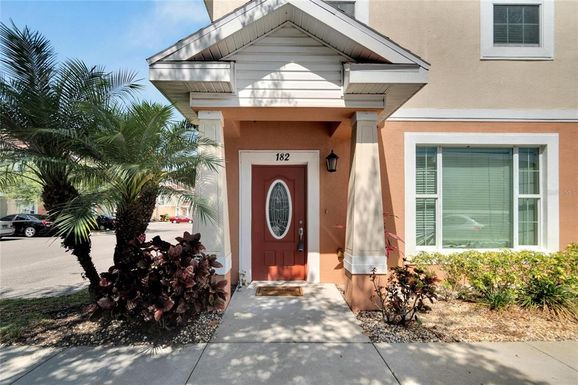
Plant City, FL Market Trend for Condos / Townhouses / Penthouses
Average List Price
The average list price of condos/co-ops in Plant City, FL, was $271,782 in May 2024, compared to $281,278 in May 2023.
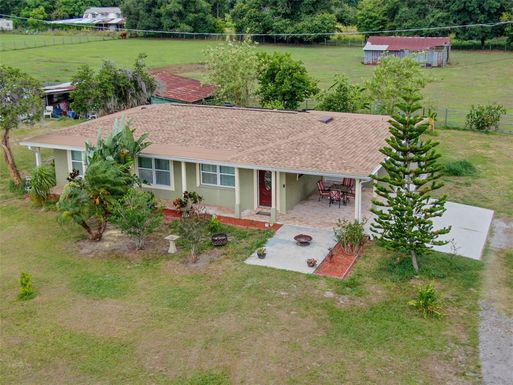
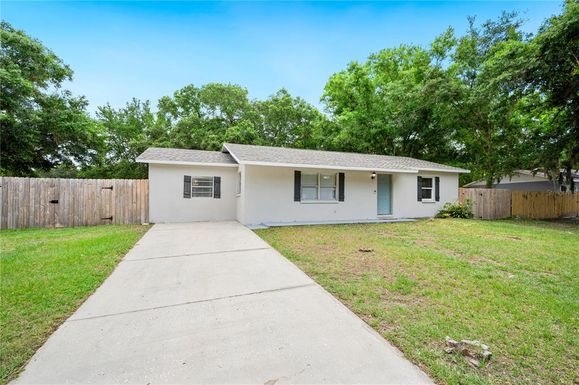
Plant City, FL Market Trend for Lots/Land
Average List Price
The average list price of lots/land in Plant City, FL, was $757,700 in May 2024, compared to $492,781 in May 2023.
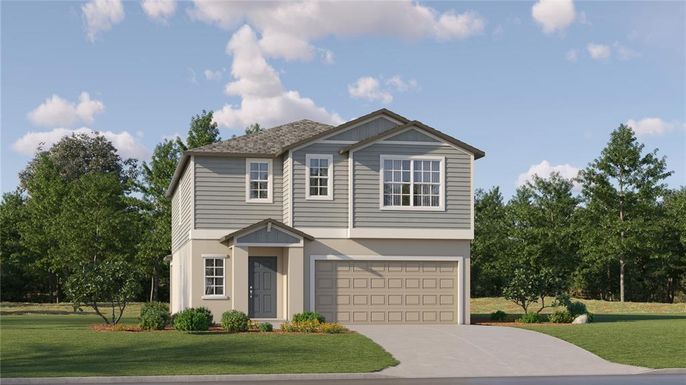
Plant City, FL Market Trend for Commercial
Average List Price
The average list price of commercial in Plant City, FL, was $987,188 in May 2024, compared to $333,590 in May 2023.
Plant City, FL Housing Market Analysis
The average list price in Plant City, FL is $548,813. The average list price in Plant City, FL went up 33.70% from 2023 to 2024. Plant City, FL home resale inventories is 333, which decreased 8.52% since 2023. The average list price per square foot in Plant City, FL is $240. 2023 it was $201.