In May 2024, Brandon, FL homes were selling for an average price of $406,912, Brandon, FL homes on average sell after 46 days on the market compared to 35 days last year. There were 898 homes sold in Brandon, FL for May 2024, compared to 1139 last year.
The average list price of Brandon, FL, was $490,293 in May 2024, compared to $482,129 in May 2023.
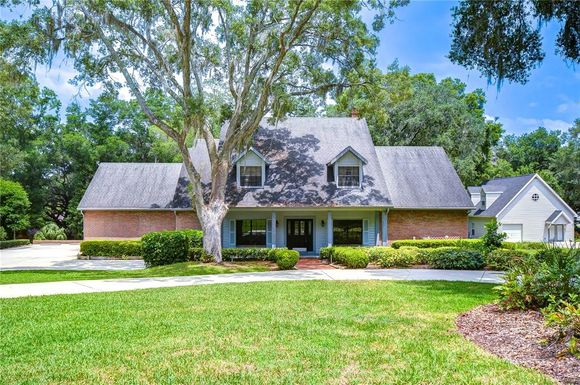
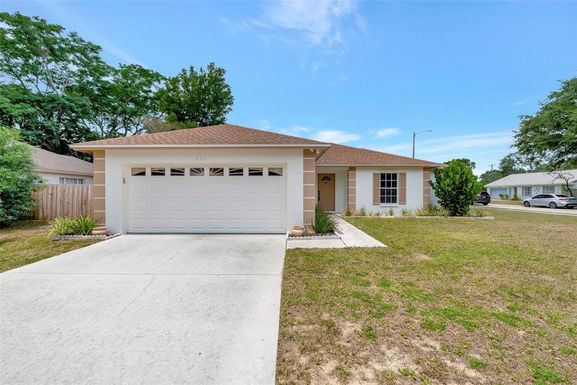
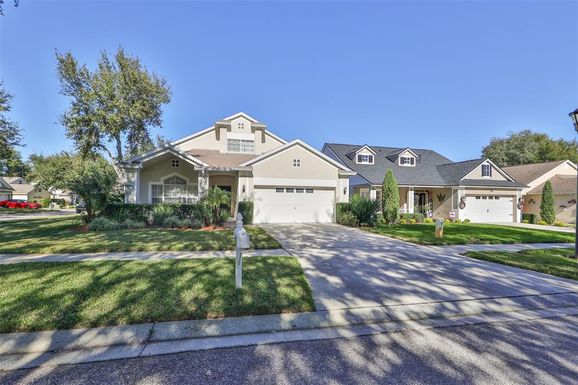
Brandon, FL Market Trend for Houses
Average List Price
The average list price of houses in Brandon, FL, was $514,829 in May 2024, compared to $502,624 in May 2023.
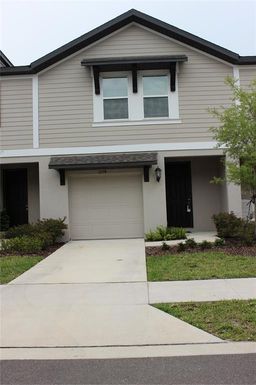
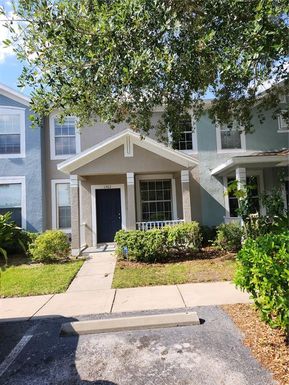
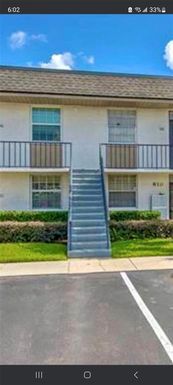
Brandon, FL Market Trend for Condos / Townhouses / Penthouses
Average List Price
The average list price of condos/co-ops in Brandon, FL, was $291,077 in May 2024, compared to $247,807 in May 2023.
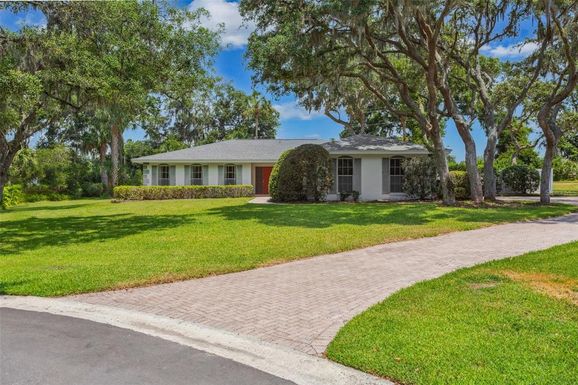
Brandon, FL Market Trend for Lots/Land
Average List Price
The average list price of lots/land in Brandon, FL, was $1,037,656 in May 2024, compared to $776,885 in May 2023.
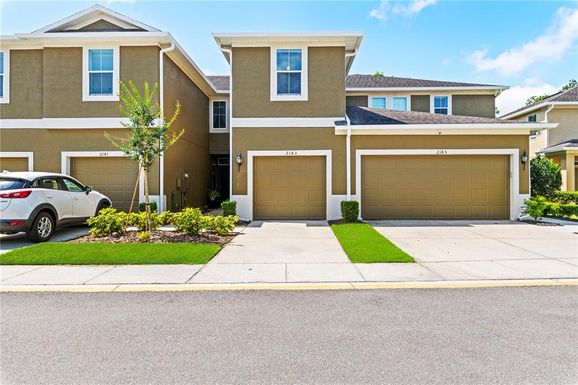
Brandon, FL Market Trend for Commercial
Average List Price
The average list price of commercial in Brandon, FL, was $648,351 in May 2024, compared to $536,767 in May 2023.
Brandon, FL Housing Market Analysis
The average list price in Brandon, FL is $490,293. The average list price in Brandon, FL went down 0.94% from 2023 to 2024. Brandon, FL home resale inventories is 183, which increased 1.67% since 2023. The average list price per square foot in Brandon, FL is $235. 2023 it was $223.