In May 2024, Mulberry, FL homes were selling for an average price of $304,222, Mulberry, FL homes on average sell after 51 days on the market compared to 38 days last year. There were 335 homes sold in Mulberry, FL for May 2024, compared to 394 last year.
The average list price of Mulberry, FL, was $388,389 in May 2024, compared to $290,900 in May 2023.
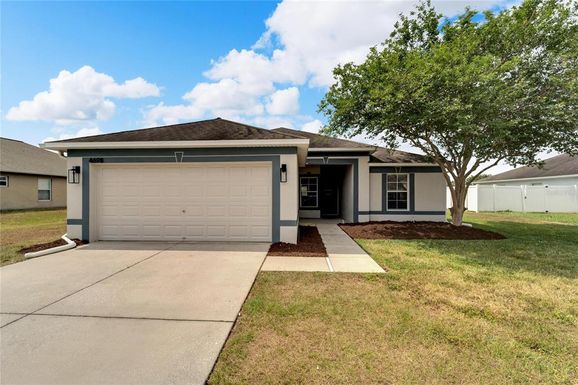
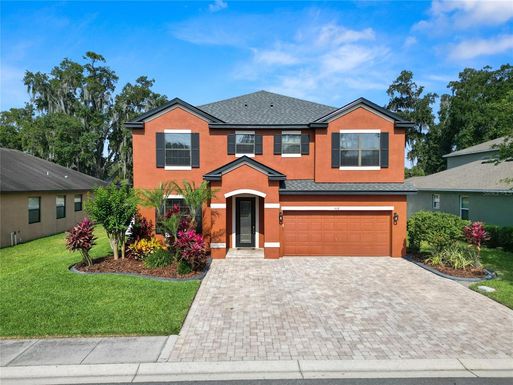
Mulberry, FL Market Trend for Houses
Average List Price
The average list price of houses in Mulberry, FL, was $496,068 in May 2024, compared to $346,386 in May 2023.
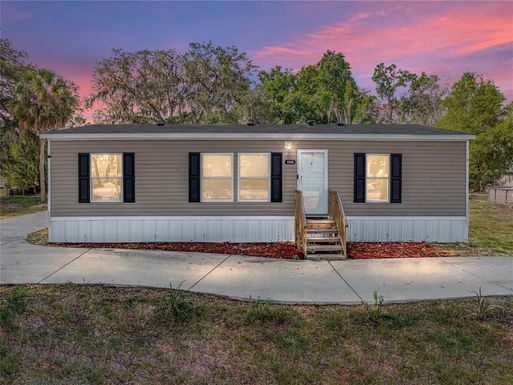
Mulberry, FL Market Trend for Condos / Townhouses / Penthouses
Average List Price
The average list price of condos/co-ops in Mulberry, FL, was $208,867 in May 2024, compared to $139,000 in May 2023.
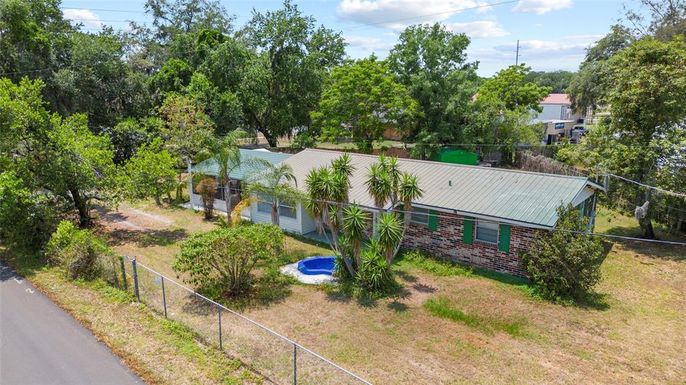
Mulberry, FL Market Trend for Lots/Land
Average List Price
The average list price of lots/land in Mulberry, FL, was $205,252 in May 2024, compared to $128,231 in May 2023.
Mulberry, FL Market Trend for Commercial
Average List Price
The average list price of commercial in Mulberry, FL, was $347,975 in May 2024, compared to $504,850 in May 2023.
Mulberry, FL Housing Market Analysis
The average list price in Mulberry, FL is $388,389. The average list price in Mulberry, FL went up 30.24% from 2023 to 2024. Mulberry, FL home resale inventories is 108, which increased 35.00% since 2023. The average list price per square foot in Mulberry, FL is $205. 2023 it was $192.