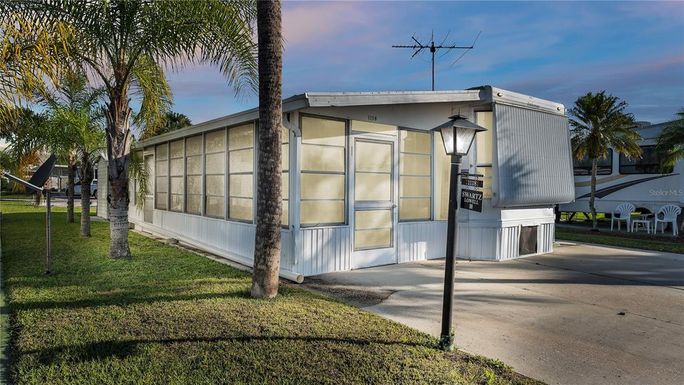
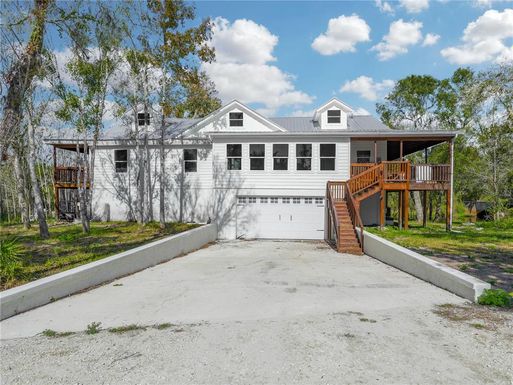
In May 2024, Bowling Green, FL homes were selling for an average price of $200,114, Bowling Green, FL homes on average sell after 70 days on the market compared to 39 days last year. There were 28 homes sold in Bowling Green, FL for May 2024, compared to 24 last year.
The average list price of condos/co-ops in Bowling Green, FL, was $0 in May 2024, compared to $0 in May 2023.
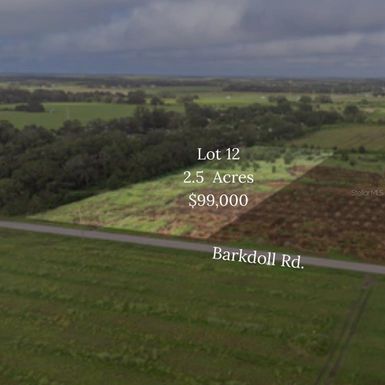
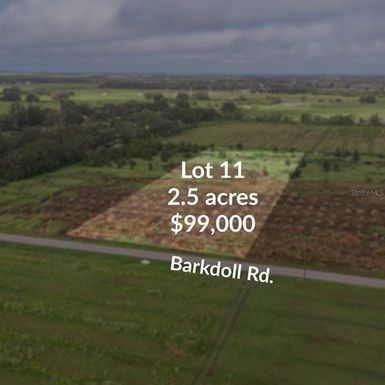
Bowling Green, FL Market Trend for Lots/Land
Average List Price
The average list price of lots/land in Bowling Green, FL, was $99,000 in May 2024, compared to $1,154,000 in May 2023.
Bowling Green, FL Market Trend for Commercial
Average List Price
The average list price of commercial in Bowling Green, FL, was $0 in May 2024, compared to $0 in May 2023.
Bowling Green, FL Housing Market Analysis
The average list price in Bowling Green, FL is $212,558. The average list price in Bowling Green, FL went down 51.13% from 2023 to 2024. Bowling Green, FL home resale inventories is 12, which increased 71.43% since 2023. The average list price per square foot in Bowling Green, FL is $176. 2023 it was $157.