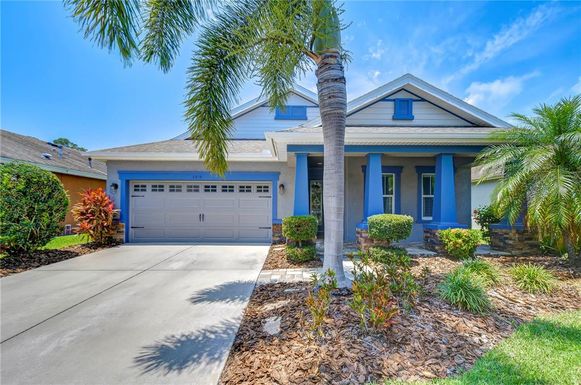
In May 2024, Apollo Beach, FL homes were selling for an average price of $579,124, Apollo Beach, FL homes on average sell after 63 days on the market compared to 39 days last year. There were 921 homes sold in Apollo Beach, FL for May 2024, compared to 1000 last year.
The average list price of Apollo Beach, FL, was $641,489 in May 2024, compared to $598,860 in May 2023.
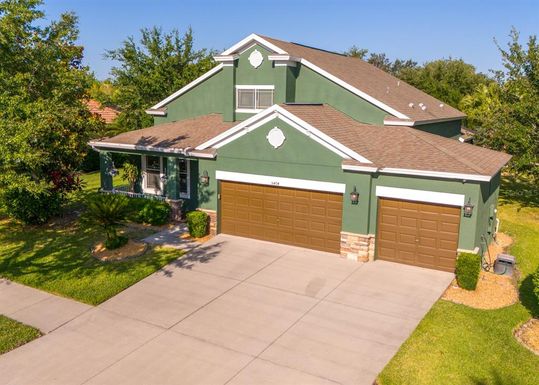
Apollo Beach, FL Market Trend for Houses
Average List Price
The average list price of houses in Apollo Beach, FL, was $693,211 in May 2024, compared to $685,011 in May 2023.
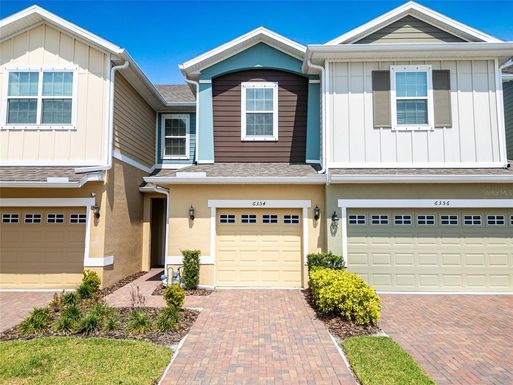
Apollo Beach, FL Market Trend for Condos / Townhouses / Penthouses
Average List Price
The average list price of condos/co-ops in Apollo Beach, FL, was $441,194 in May 2024, compared to $323,604 in May 2023.
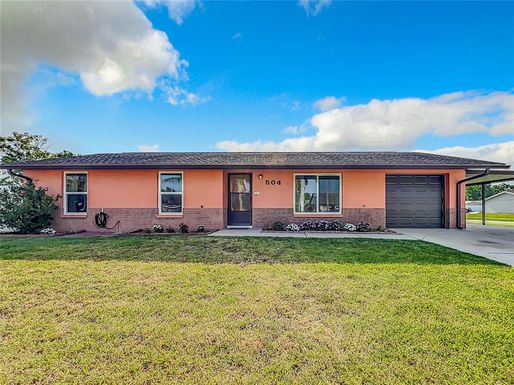
Apollo Beach, FL Market Trend for Lots/Land
Average List Price
The average list price of lots/land in Apollo Beach, FL, was $576,031 in May 2024, compared to $775,980 in May 2023.
Apollo Beach, FL Market Trend for Commercial
Average List Price
The average list price of commercial in Apollo Beach, FL, was $257,000 in May 2024, compared to $17,020 in May 2023.
Apollo Beach, FL Housing Market Analysis
The average list price in Apollo Beach, FL is $641,489. The average list price in Apollo Beach, FL went up 6.03% from 2023 to 2024. Apollo Beach, FL home resale inventories is 382, which increased 28.19% since 2023. The average list price per square foot in Apollo Beach, FL is $272. 2023 it was $247.