In May 2024, Sebring, FL homes were selling for an average price of $158,266, Sebring, FL homes on average sell after 94 days on the market compared to 77 days last year. There were 506 homes sold in Sebring, FL for May 2024, compared to 404 last year.
The average list price of Sebring, FL, was $166,336 in May 2024, compared to $139,333 in May 2023.
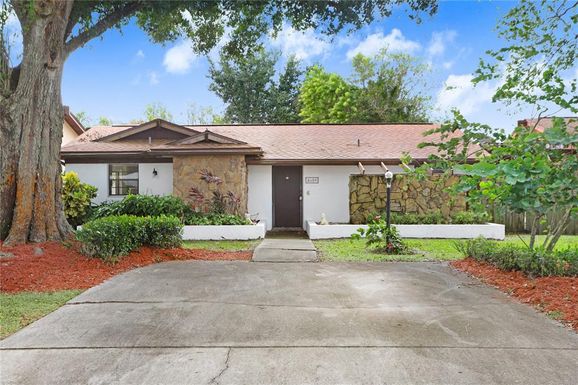
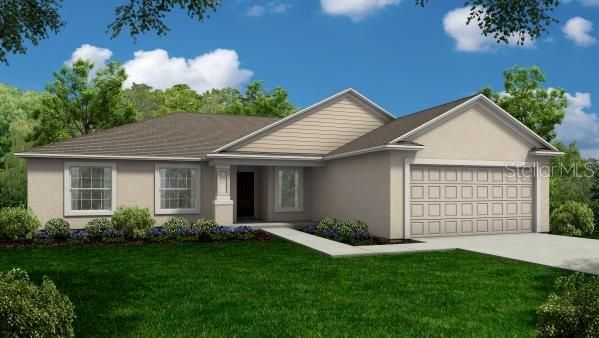
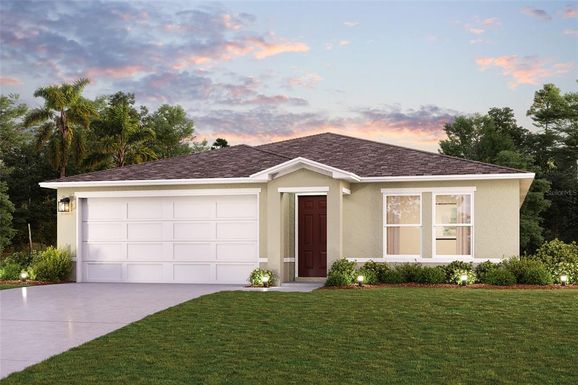
Sebring, FL Market Trend for Houses
Average List Price
The average list price of houses in Sebring, FL, was $350,651 in May 2024, compared to $312,861 in May 2023.
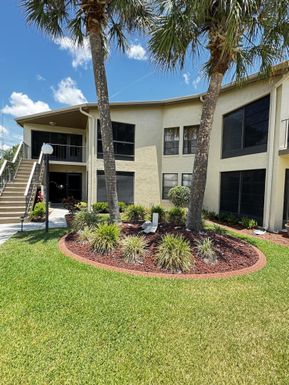
Sebring, FL Market Trend for Condos / Townhouses / Penthouses
Average List Price
The average list price of condos/co-ops in Sebring, FL, was $201,038 in May 2024, compared to $94,900 in May 2023.
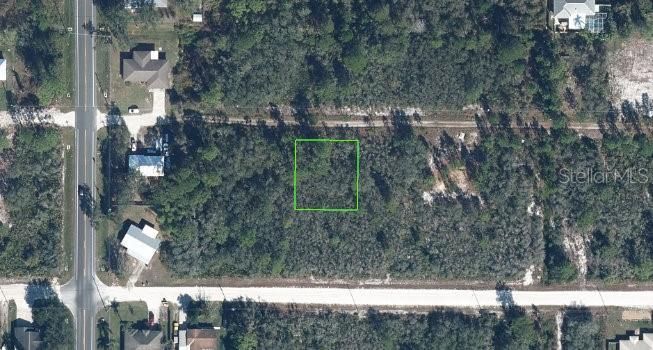
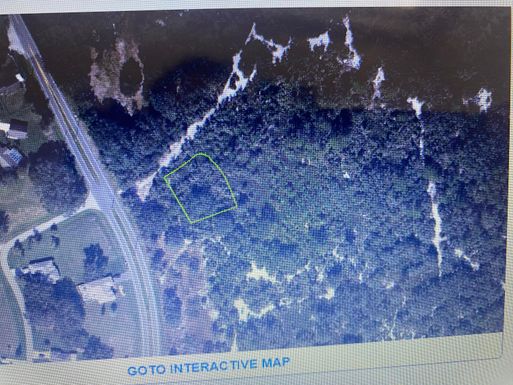
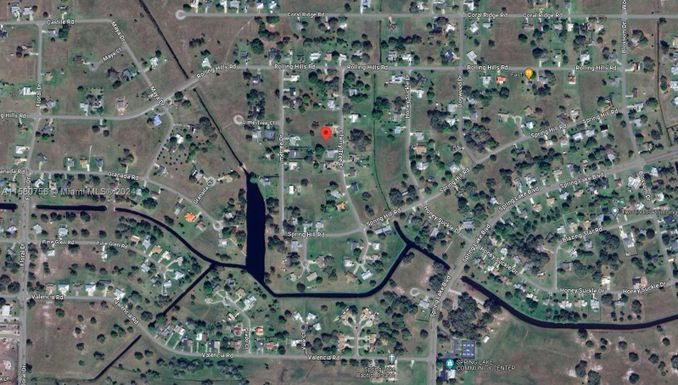
Sebring, FL Market Trend for Lots/Land
Average List Price
The average list price of lots/land in Sebring, FL, was $86,309 in May 2024, compared to $44,558 in May 2023.
Sebring, FL Market Trend for Commercial
Average List Price
The average list price of commercial in Sebring, FL, was $131,273 in May 2024, compared to $187,583 in May 2023.
Sebring, FL Housing Market Analysis
The average list price in Sebring, FL is $166,336. The average list price in Sebring, FL went up 11.28% from 2023 to 2024. Sebring, FL home resale inventories is 549, which increased 182.99% since 2023. The average list price per square foot in Sebring, FL is $182. 2023 it was $228.