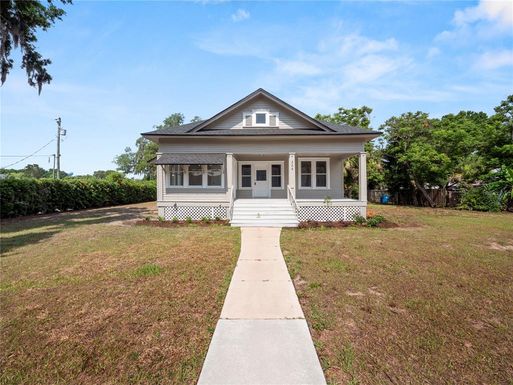
In May 2024, 33843, FL homes were selling for an average price of $189,444, 33843, FL homes on average sell after 104 days on the market compared to 84 days last year. There were 263 homes sold in 33843, FL for May 2024, compared to 240 last year.
The average list price of 33843, FL, was $242,698 in May 2024, compared to $190,787 in May 2023.
33843, FL Market Trend for Houses
Average List Price
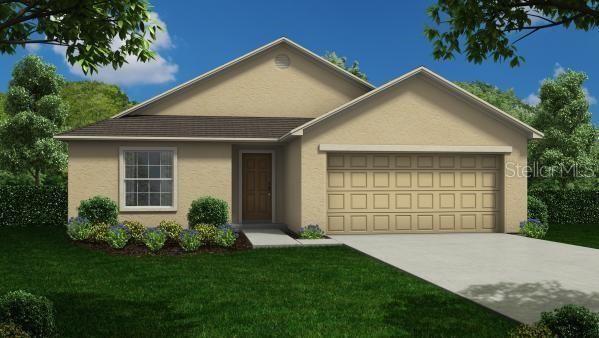
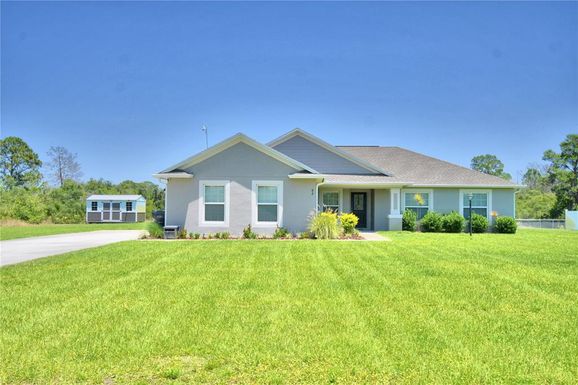
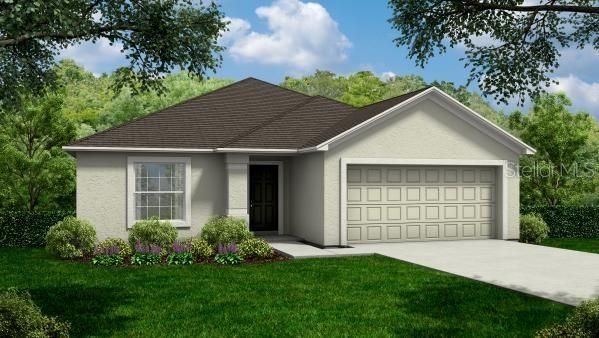
The average list price of houses in 33843, FL, was $271,932 in May 2024, compared to $293,758 in May 2023.
33843, FL Market Trend for Condos / Townhouses / Penthouses
Average List Price
The average list price of condos/co-ops in 33843, FL, was $0 in May 2024, compared to $0 in May 2023.
33843, FL Market Trend for Lots/Land
Average List Price
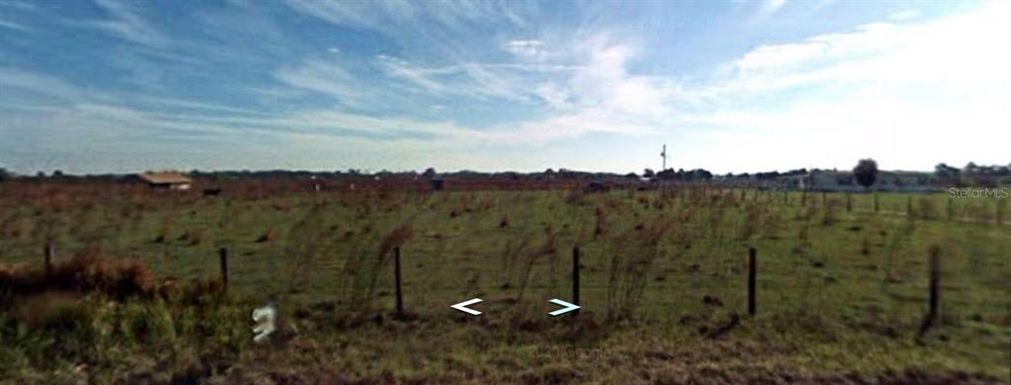
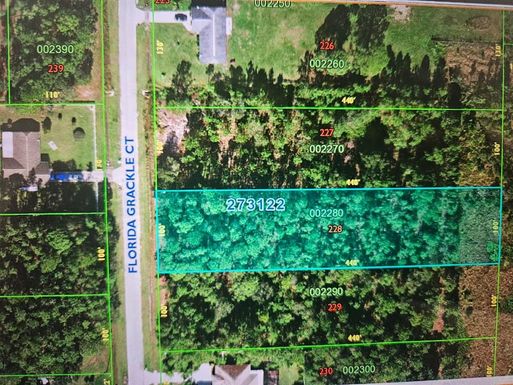
The average list price of lots/land in 33843, FL, was $232,421 in May 2024, compared to $140,758 in May 2023.
33843, FL Market Trend for Commercial
Average List Price
The average list price of commercial in 33843, FL, was $266,506 in May 2024, compared to $258,699 in May 2023.
33843, FL Housing Market Analysis
The average list price in 33843, FL is $242,698. The average list price in 33843, FL went up 33.59% from 2023 to 2024. 33843, FL home resale inventories is 163, which increased 22.56% since 2023. The average list price per square foot in 33843, FL is $221. 2023 it was $188.