In May 2024, Ocklawaha, FL homes were selling for an average price of $143,139, Ocklawaha, FL homes on average sell after 87 days on the market compared to 78 days last year. There were 515 homes sold in Ocklawaha, FL for May 2024, compared to 472 last year.
The average list price of Ocklawaha, FL, was $158,036 in May 2024, compared to $127,908 in May 2023.
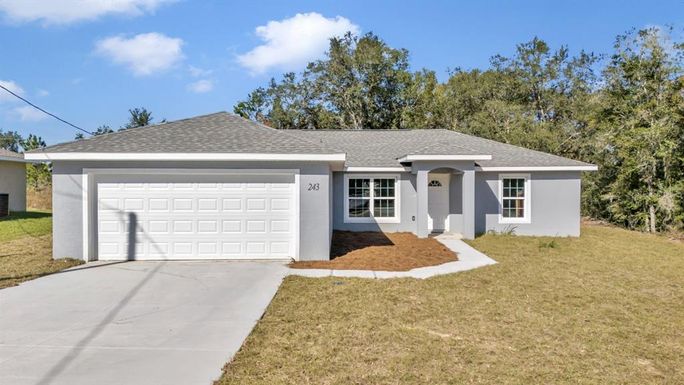
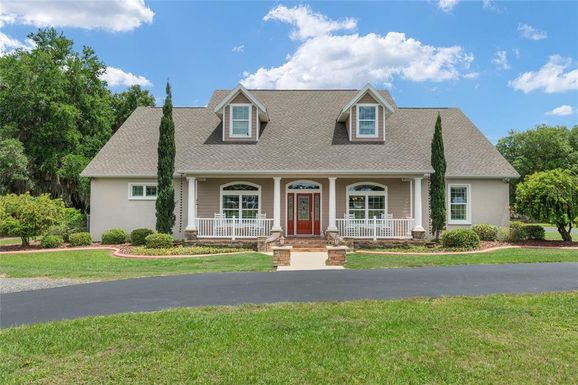
Ocklawaha, FL Market Trend for Houses
Average List Price
The average list price of houses in Ocklawaha, FL, was $372,418 in May 2024, compared to $282,570 in May 2023.
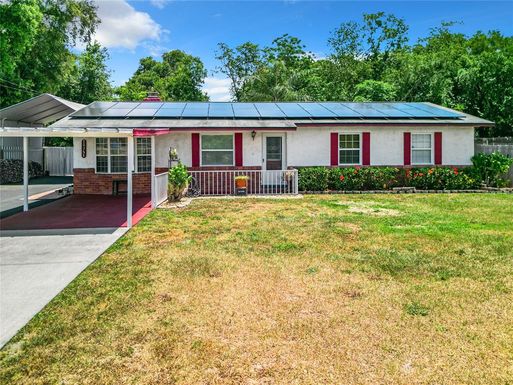
Ocklawaha, FL Market Trend for Condos / Townhouses / Penthouses
Average List Price
The average list price of condos/co-ops in Ocklawaha, FL, was $0 in May 2024, compared to $0 in May 2023.
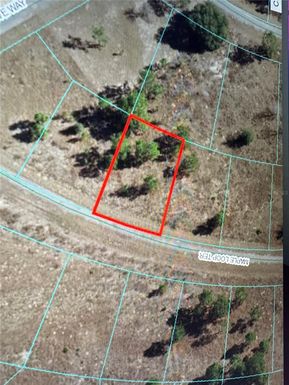
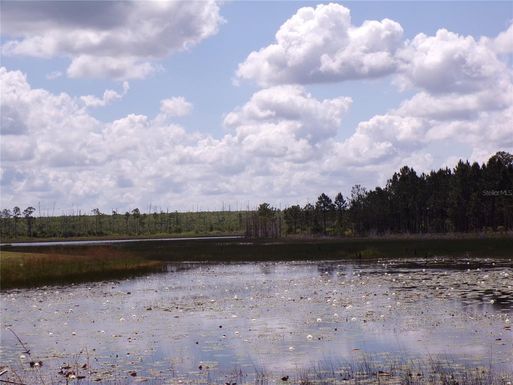
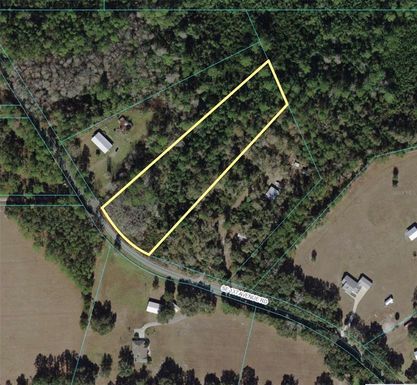
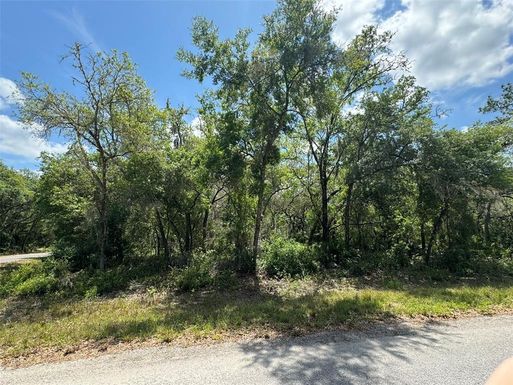
Ocklawaha, FL Market Trend for Lots/Land
Average List Price
The average list price of lots/land in Ocklawaha, FL, was $75,357 in May 2024, compared to $34,535 in May 2023.
Ocklawaha, FL Market Trend for Commercial
Average List Price
The average list price of commercial in Ocklawaha, FL, was $129,686 in May 2024, compared to $0 in May 2023.
Ocklawaha, FL Housing Market Analysis
The average list price in Ocklawaha, FL is $158,036. The average list price in Ocklawaha, FL went up 31.84% from 2023 to 2024. Ocklawaha, FL home resale inventories is 275, which increased 19.05% since 2023. The average list price per square foot in Ocklawaha, FL is $195. 2023 it was $177.