In May 2024, Malabar, FL homes were selling for an average price of $736,200, Malabar, FL homes on average sell after 69 days on the market compared to 80 days last year. There were 4 homes sold in Malabar, FL for May 2024, compared to 15 last year.
The average list price of Malabar, FL, was $268,627 in May 2024, compared to $195,362 in May 2023.
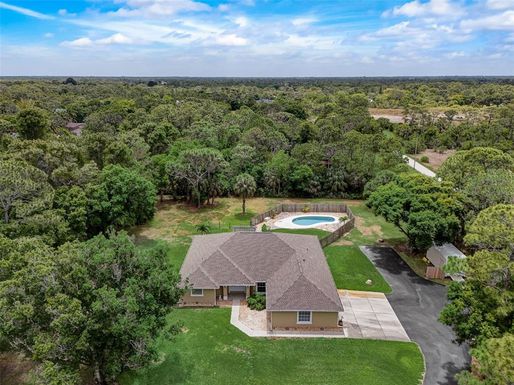
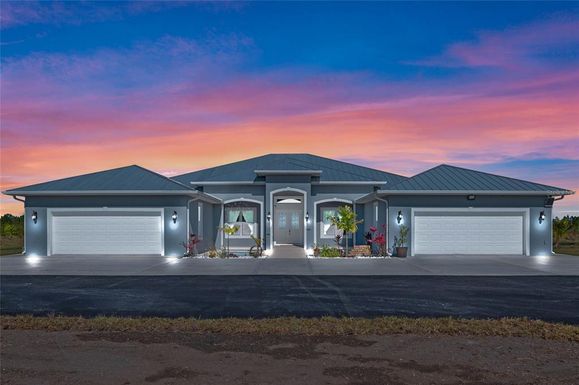
Malabar, FL Market Trend for Houses
Average List Price
The average list price of houses in Malabar, FL, was $1,299,450 in May 2024, compared to $699,950 in May 2023.
Malabar, FL Market Trend for Condos / Townhouses / Penthouses
Average List Price
The average list price of condos/co-ops in Malabar, FL, was $0 in May 2024, compared to $0 in May 2023.
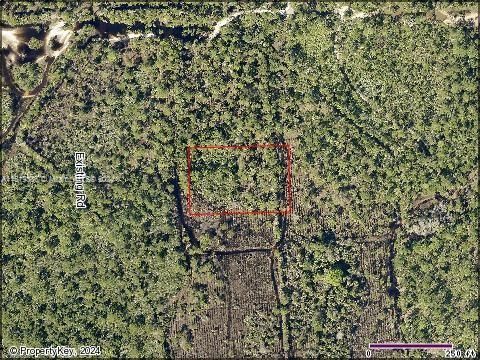
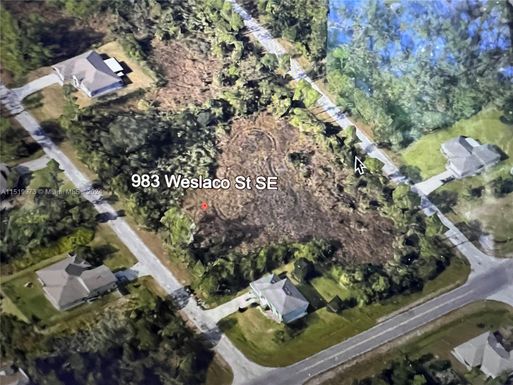
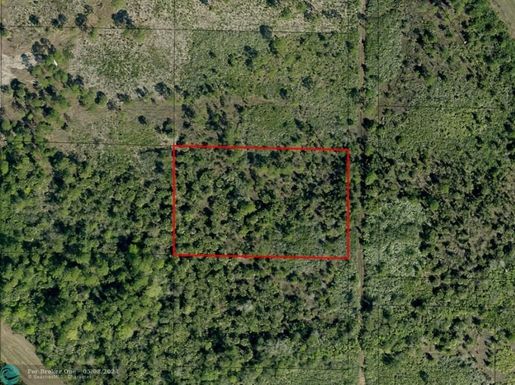
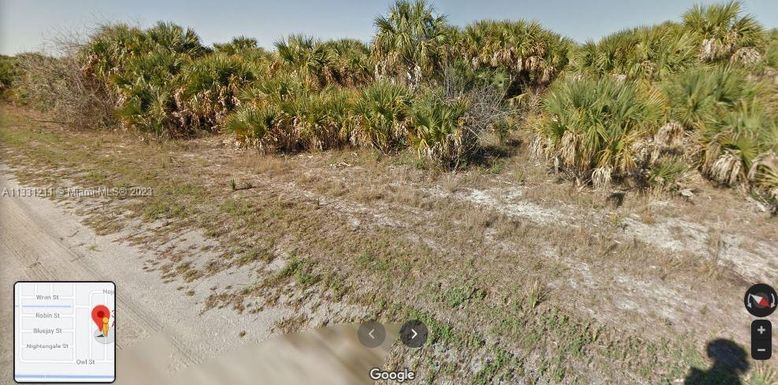
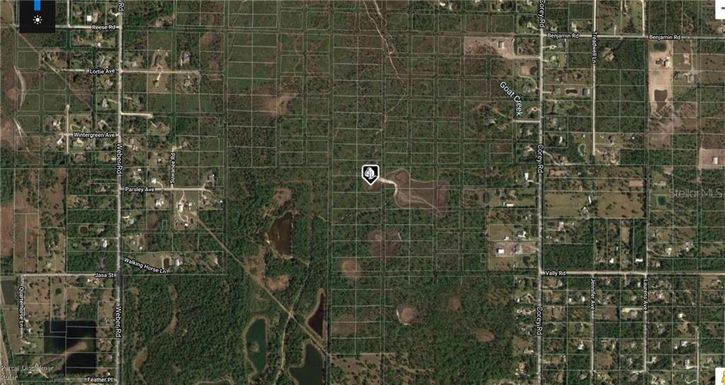
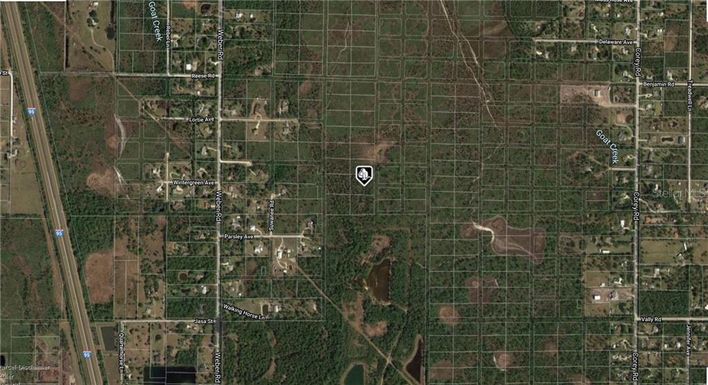
Malabar, FL Market Trend for Lots/Land
Average List Price
The average list price of lots/land in Malabar, FL, was $28,874 in May 2024, compared to $27,166 in May 2023.
Malabar, FL Market Trend for Commercial
Average List Price
The average list price of commercial in Malabar, FL, was $125,000 in May 2024, compared to $0 in May 2023.
Malabar, FL Housing Market Analysis
The average list price in Malabar, FL is $268,627. The average list price in Malabar, FL went up 112.98% from 2023 to 2024. Malabar, FL home resale inventories is 11, which increased 57.14% since 2023. The average list price per square foot in Malabar, FL is $374. 2023 it was $219.