In May 2024, Lee, FL homes were selling for an average price of $315,013, Lee, FL homes on average sell after 69 days on the market compared to 51 days last year. There were 1451 homes sold in Lee, FL for May 2024, compared to 1624 last year.
The average list price of Lee, FL, was $437,843 in May 2024, compared to $349,456 in May 2023.
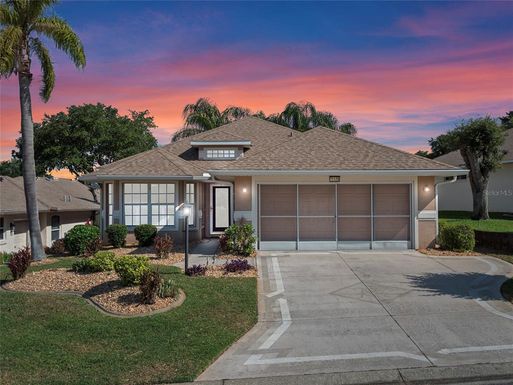
Lee, FL Market Trend for Houses
Average List Price
The average list price of houses in Lee, FL, was $387,973 in May 2024, compared to $345,990 in May 2023.
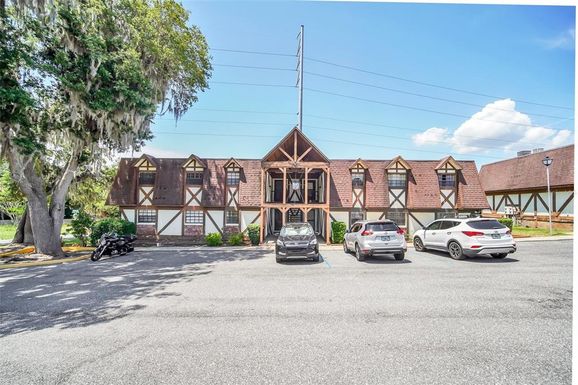
Lee, FL Market Trend for Condos / Townhouses / Penthouses
Average List Price
The average list price of condos/co-ops in Lee, FL, was $158,731 in May 2024, compared to $161,970 in May 2023.
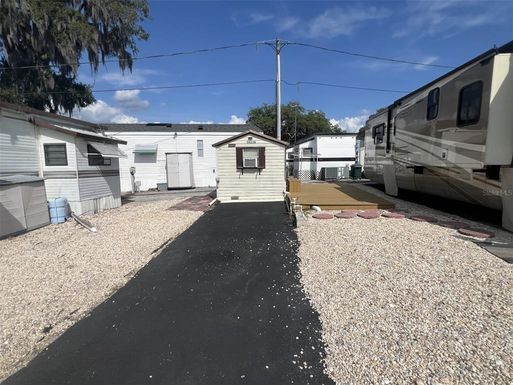
Lee, FL Market Trend for Lots/Land
Average List Price
The average list price of lots/land in Lee, FL, was $777,655 in May 2024, compared to $448,436 in May 2023.
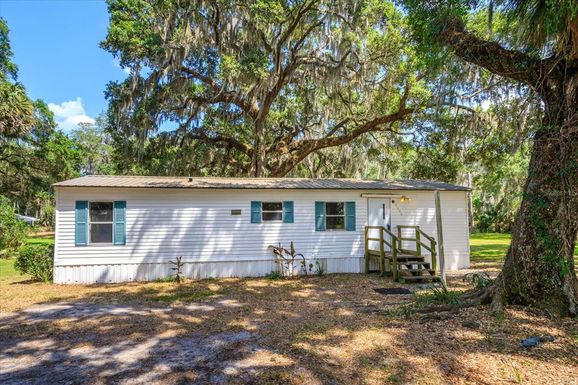
Lee, FL Market Trend for Commercial
Average List Price
The average list price of commercial in Lee, FL, was $546,015 in May 2024, compared to $383,418 in May 2023.
Lee, FL Housing Market Analysis
The average list price in Lee, FL is $437,843. The average list price in Lee, FL went up 23.61% from 2023 to 2024. Lee, FL home resale inventories is 519, which increased 11.61% since 2023. The average list price per square foot in Lee, FL is $188. 2023 it was $177.