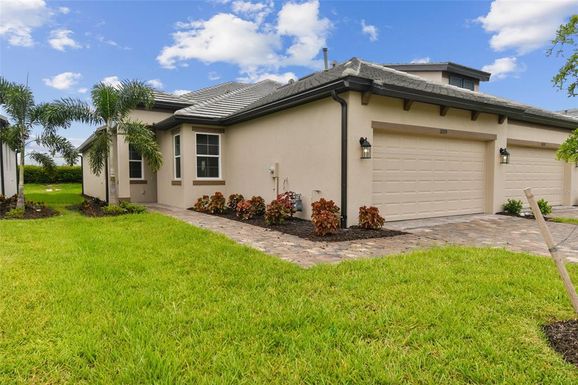
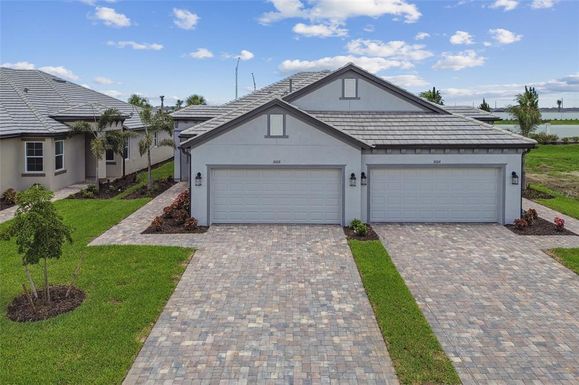
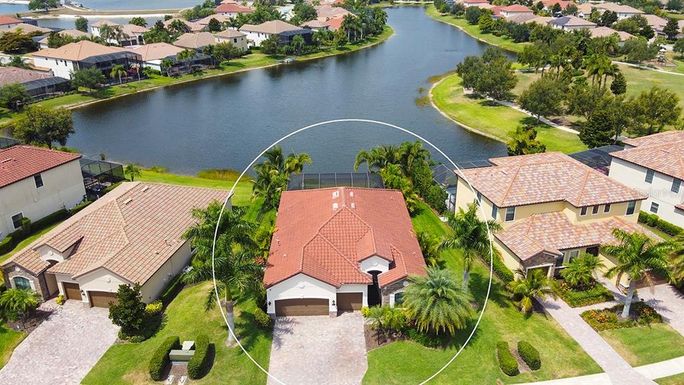
In May 2024, 34211, FL homes were selling for an average price of $638,420, 34211, FL homes on average sell after 64 days on the market compared to 24 days last year. There were 127 homes sold in 34211, FL for May 2024, compared to 26 last year.
The average list price of 34211, FL, was $641,613 in May 2024, compared to $789,900 in May 2023.
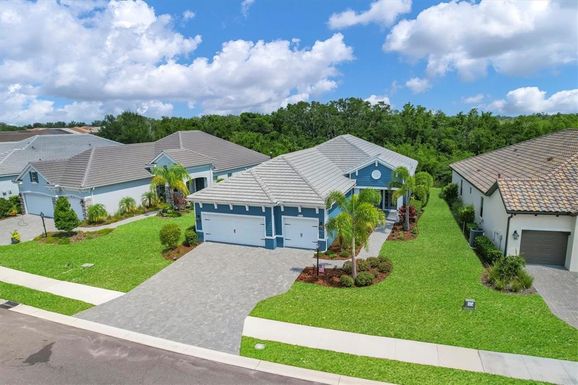
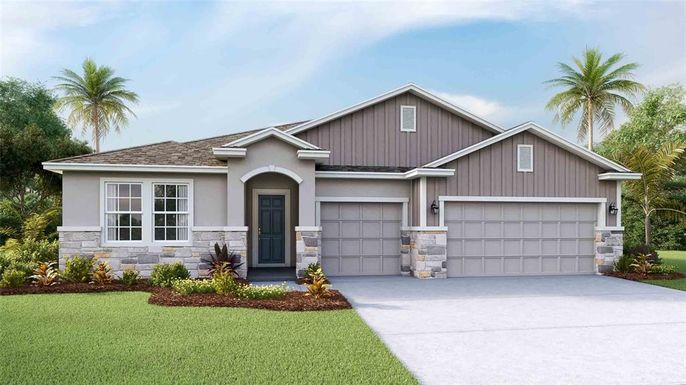
34211, FL Market Trend for Houses
Average List Price
The average list price of houses in 34211, FL, was $722,241 in May 2024, compared to $789,900 in May 2023.
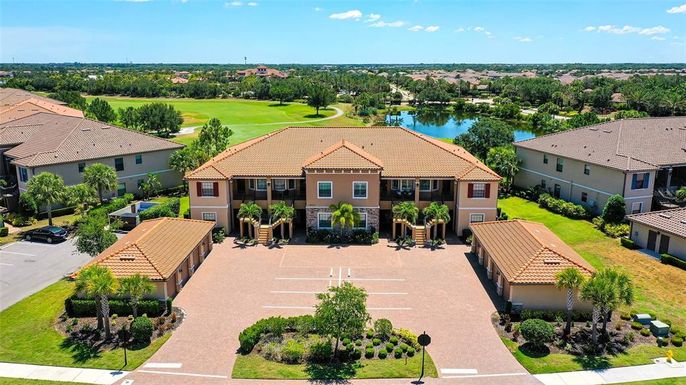
34211, FL Market Trend for Condos / Townhouses / Penthouses
Average List Price
The average list price of condos/co-ops in 34211, FL, was $411,694 in May 2024, compared to $0 in May 2023.
34211, FL Market Trend for Lots/Land
Average List Price
The average list price of lots/land in 34211, FL, was $404,500 in May 2024, compared to $0 in May 2023.
34211, FL Market Trend for Commercial
Average List Price
The average list price of commercial in 34211, FL, was $0 in May 2024, compared to $0 in May 2023.
34211, FL Housing Market Analysis
The average list price in 34211, FL is $641,613. The average list price in 34211, FL went down 18.77% from 2023 to 2024. 34211, FL home resale inventories is 442, which increased 44100.00% since 2023. The average list price per square foot in 34211, FL is $303. 2023 it was $321.