In May 2024, 33759, FL homes were selling for an average price of $430,763, 33759, FL homes on average sell after 43 days on the market compared to 33 days last year. There were 226 homes sold in 33759, FL for May 2024, compared to 218 last year.
The average list price of 33759, FL, was $492,984 in May 2024, compared to $428,652 in May 2023.
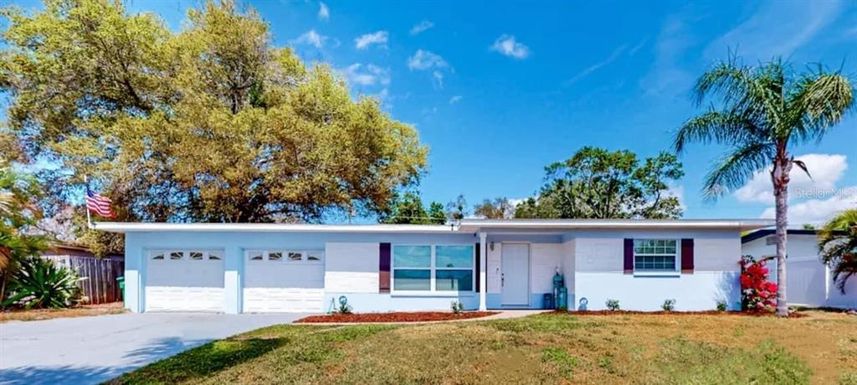
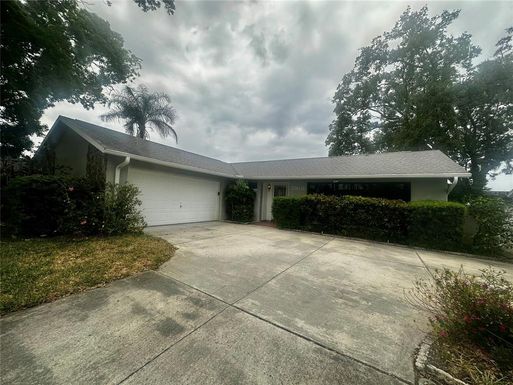
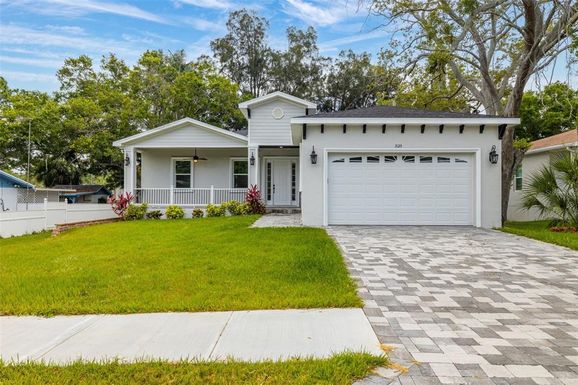
33759, FL Market Trend for Houses
Average List Price
The average list price of houses in 33759, FL, was $854,528 in May 2024, compared to $681,187 in May 2023.
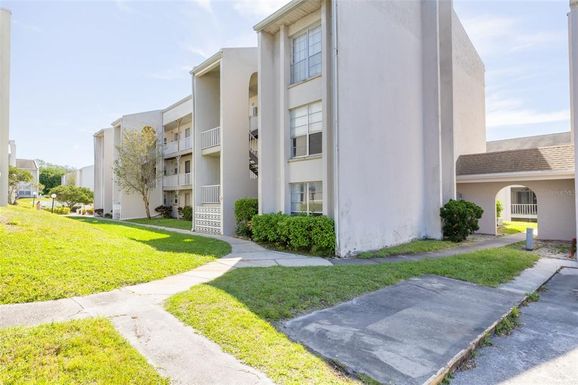
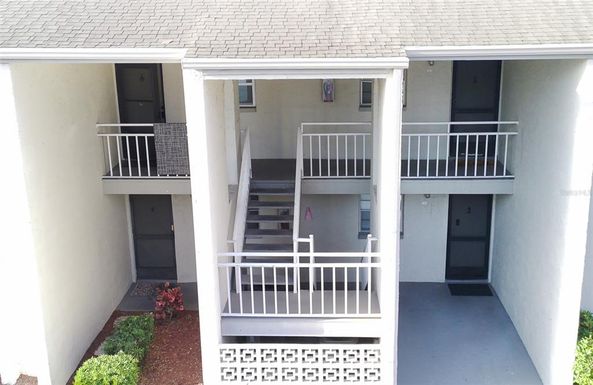
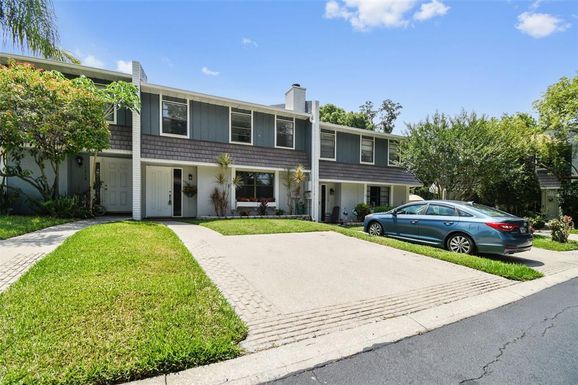
33759, FL Market Trend for Condos / Townhouses / Penthouses
Average List Price
The average list price of condos/co-ops in 33759, FL, was $189,570 in May 2024, compared to $205,800 in May 2023.
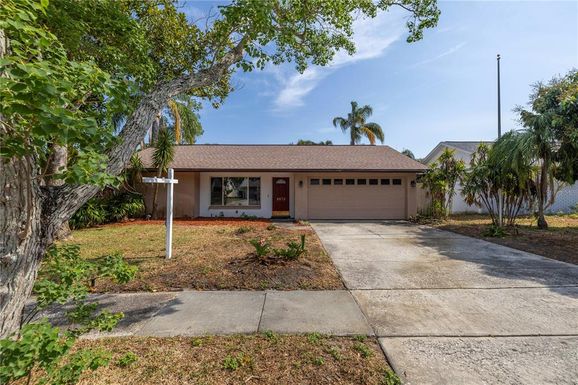
33759, FL Market Trend for Lots/Land
Average List Price
The average list price of lots/land in 33759, FL, was $1,847,000 in May 2024, compared to $238,750 in May 2023.
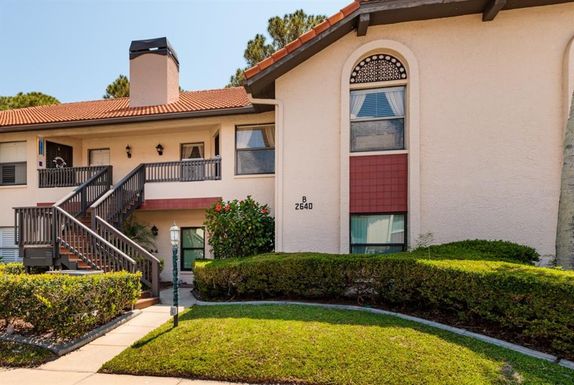
33759, FL Market Trend for Commercial
Average List Price
The average list price of commercial in 33759, FL, was $29,000 in May 2024, compared to $5,988 in May 2023.
33759, FL Housing Market Analysis
The average list price in 33759, FL is $492,984. The average list price in 33759, FL went up 19.19% from 2023 to 2024. 33759, FL home resale inventories is 83, which increased 56.60% since 2023. The average list price per square foot in 33759, FL is $247. 2023 it was $241.