In May 2024, 33569, FL homes were selling for an average price of $428,866, 33569, FL homes on average sell after 42 days on the market compared to 35 days last year. There were 531 homes sold in 33569, FL for May 2024, compared to 606 last year.
The average list price of 33569, FL, was $516,720 in May 2024, compared to $458,838 in May 2023.
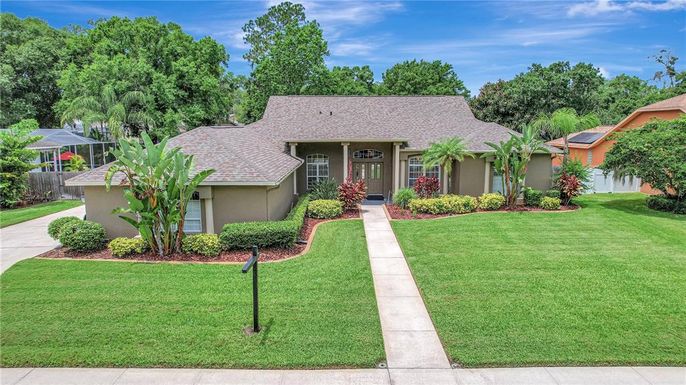
33569, FL Market Trend for Houses
Average List Price
The average list price of houses in 33569, FL, was $555,608 in May 2024, compared to $495,392 in May 2023.
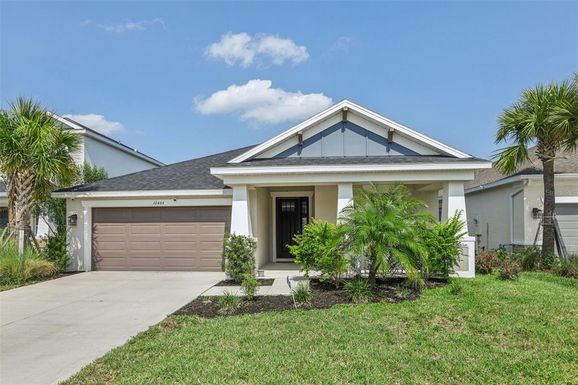
33569, FL Market Trend for Condos / Townhouses / Penthouses
Average List Price
The average list price of condos/co-ops in 33569, FL, was $369,872 in May 2024, compared to $338,520 in May 2023.
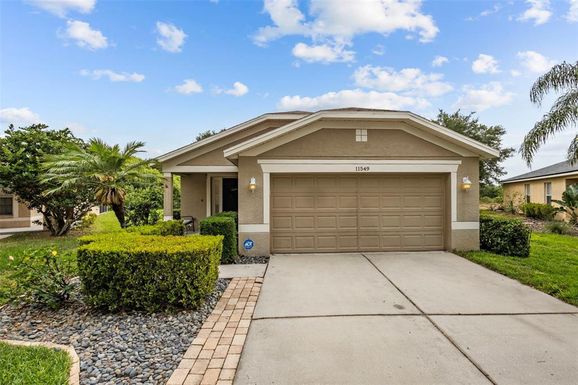
33569, FL Market Trend for Lots/Land
Average List Price
The average list price of lots/land in 33569, FL, was $318,250 in May 2024, compared to $275,165 in May 2023.
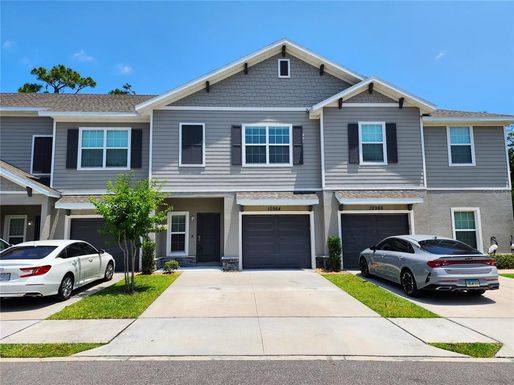
33569, FL Market Trend for Commercial
Average List Price
The average list price of commercial in 33569, FL, was $899,000 in May 2024, compared to $950,000 in May 2023.
33569, FL Housing Market Analysis
The average list price in 33569, FL is $516,720. The average list price in 33569, FL went up 11.77% from 2023 to 2024. 33569, FL home resale inventories is 129, which increased 1.57% since 2023. The average list price per square foot in 33569, FL is $227. 2023 it was $216.