In May 2024, 33069, FL homes were selling for an average price of $352,247, 33069, FL homes on average sell after 57 days on the market compared to 38 days last year. There were 655 homes sold in 33069, FL for May 2024, compared to 671 last year.
The average list price of 33069, FL, was $458,975 in May 2024, compared to $532,977 in May 2023.
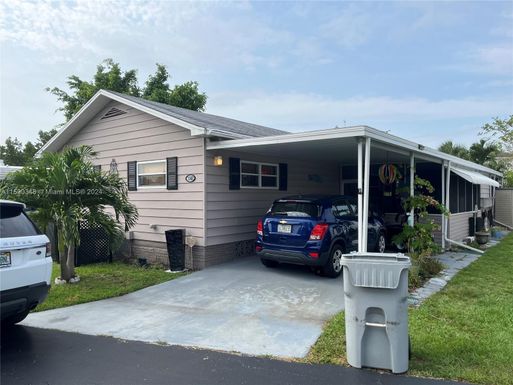
33069, FL Market Trend for Houses
Average List Price
The average list price of houses in 33069, FL, was $554,032 in May 2024, compared to $449,754 in May 2023.
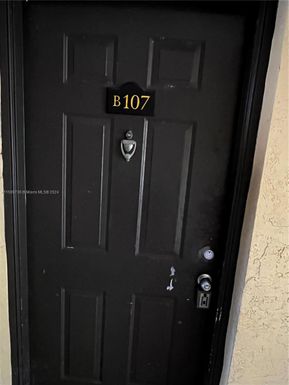
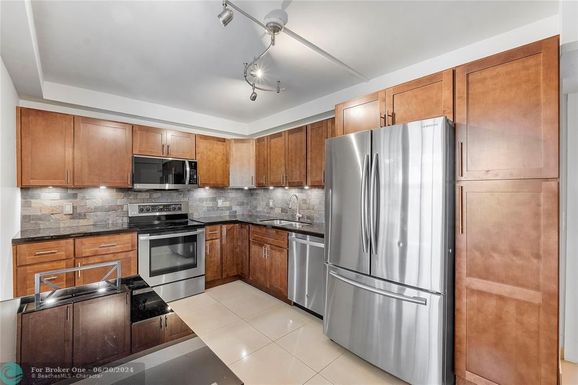
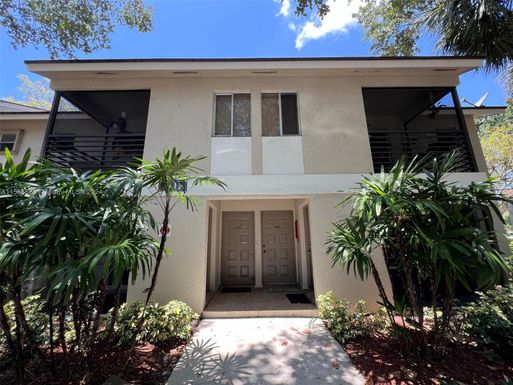
33069, FL Market Trend for Condos / Townhouses / Penthouses
Average List Price
The average list price of condos/co-ops in 33069, FL, was $285,867 in May 2024, compared to $293,023 in May 2023.
33069, FL Market Trend for Lots/Land
Average List Price
The average list price of lots/land in 33069, FL, was $252,800 in May 2024, compared to $179,800 in May 2023.
33069, FL Market Trend for Commercial
Average List Price
The average list price of commercial in 33069, FL, was $2,147,955 in May 2024, compared to $2,639,485 in May 2023.
33069, FL Housing Market Analysis
The average list price in 33069, FL is $458,975. The average list price in 33069, FL went down 14.74% from 2023 to 2024. 33069, FL home resale inventories is 399, which increased 122.91% since 2023. The average list price per square foot in 33069, FL is $242. 2023 it was $238.