In May 2024, 33065, FL homes were selling for an average price of $425,181, 33065, FL homes on average sell after 46 days on the market compared to 34 days last year. There were 696 homes sold in 33065, FL for May 2024, compared to 737 last year.
The average list price of 33065, FL, was $525,889 in May 2024, compared to $477,108 in May 2023.
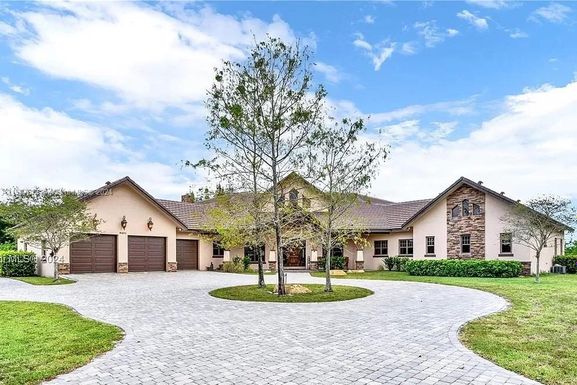
33065, FL Market Trend for Houses
Average List Price
The average list price of houses in 33065, FL, was $749,062 in May 2024, compared to $619,880 in May 2023.
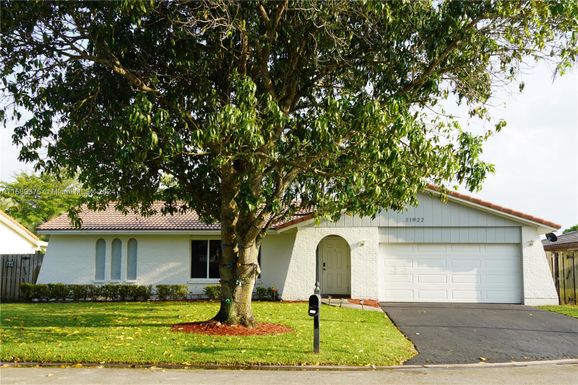
33065, FL Market Trend for Condos / Townhouses / Penthouses
Average List Price
The average list price of condos/co-ops in 33065, FL, was $235,978 in May 2024, compared to $277,775 in May 2023.
33065, FL Market Trend for Lots/Land
Average List Price
The average list price of lots/land in 33065, FL, was $999,900 in May 2024, compared to $0 in May 2023.
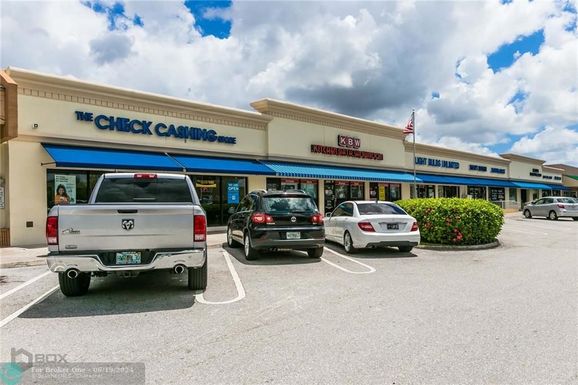
33065, FL Market Trend for Commercial
Average List Price
The average list price of commercial in 33065, FL, was $1,034,633 in May 2024, compared to $746,709 in May 2023.
33065, FL Housing Market Analysis
The average list price in 33065, FL is $525,889. The average list price in 33065, FL went up 9.22% from 2023 to 2024. 33065, FL home resale inventories is 263, which increased 56.55% since 2023. The average list price per square foot in 33065, FL is $271. 2023 it was $247.