In May 2024, 32967, FL homes were selling for an average price of $513,320, 32967, FL homes on average sell after 89 days on the market compared to 67 days last year. There were 565 homes sold in 32967, FL for May 2024, compared to 390 last year.
The average list price of 32967, FL, was $683,790 in May 2024, compared to $467,813 in May 2023.
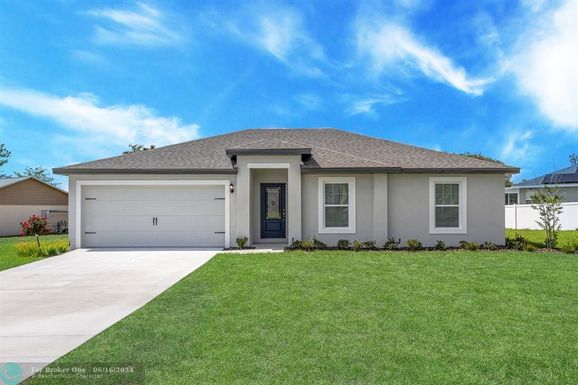
32967, FL Market Trend for Houses
Average List Price
The average list price of houses in 32967, FL, was $823,347 in May 2024, compared to $653,143 in May 2023.
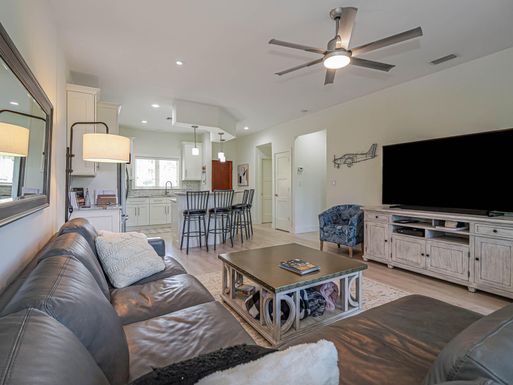
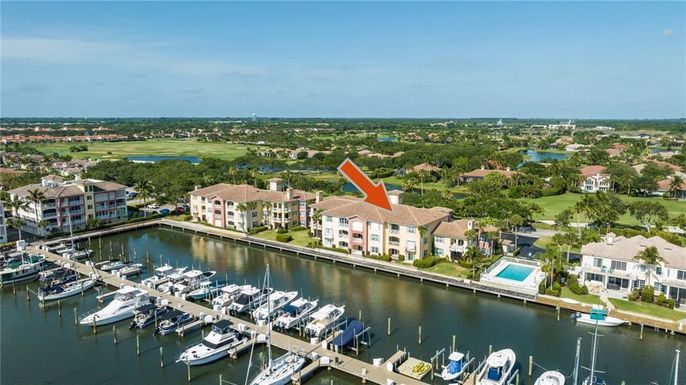
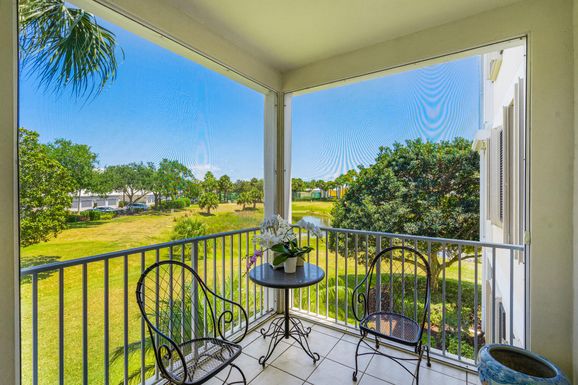
32967, FL Market Trend for Condos / Townhouses / Penthouses
Average List Price
The average list price of condos/co-ops in 32967, FL, was $423,944 in May 2024, compared to $387,757 in May 2023.
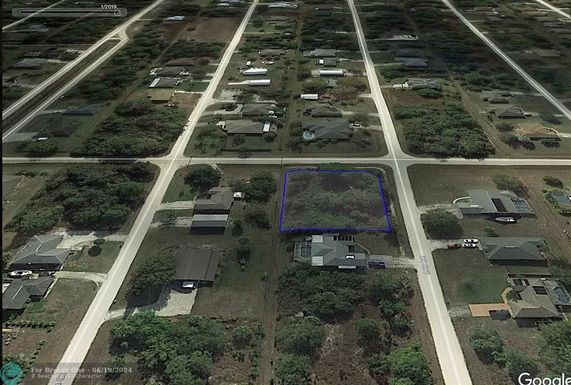
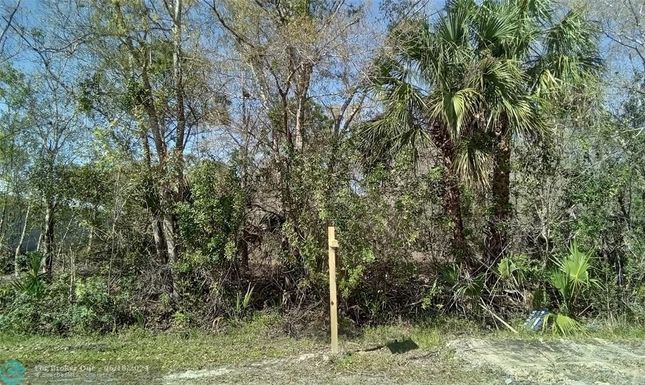
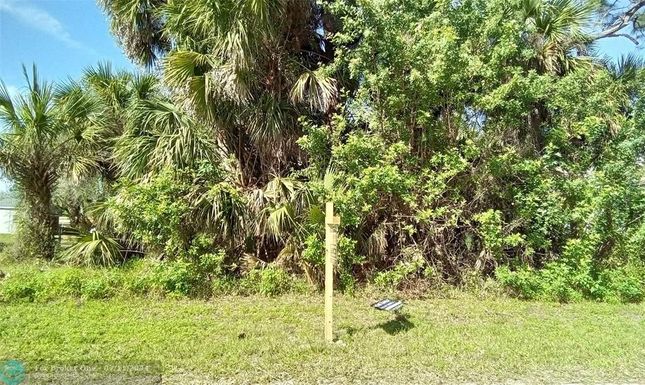
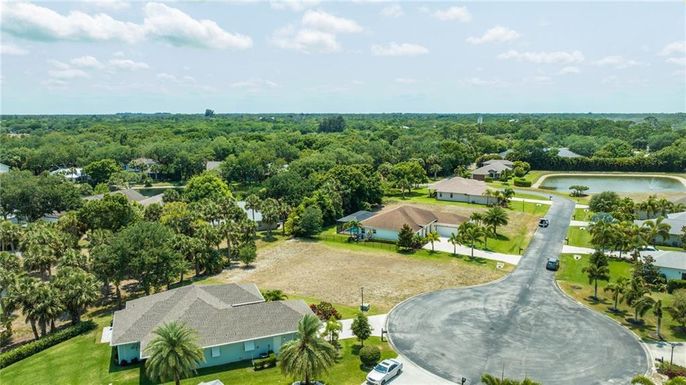
32967, FL Market Trend for Lots/Land
Average List Price
The average list price of lots/land in 32967, FL, was $243,046 in May 2024, compared to $164,217 in May 2023.
32967, FL Market Trend for Commercial
Average List Price
The average list price of commercial in 32967, FL, was $490,533 in May 2024, compared to $100,351 in May 2023.
32967, FL Housing Market Analysis
The average list price in 32967, FL is $683,790. The average list price in 32967, FL went up 43.85% from 2023 to 2024. 32967, FL home resale inventories is 231, which increased 10.53% since 2023. The average list price per square foot in 32967, FL is $3,141. 2023 it was $297.