In May 2024, 32953, FL homes were selling for an average price of $466,427, 32953, FL homes on average sell after 51 days on the market compared to 36 days last year. There were 76 homes sold in 32953, FL for May 2024, compared to 68 last year.
The average list price of 32953, FL, was $512,585 in May 2024, compared to $377,728 in May 2023.
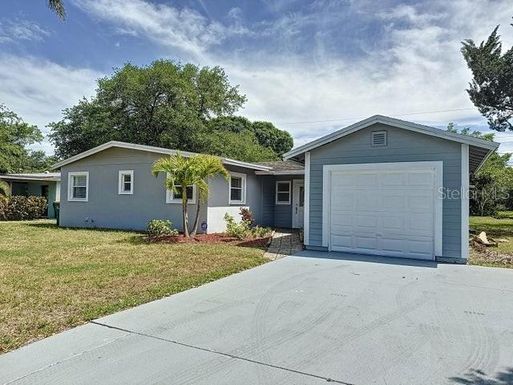
32953, FL Market Trend for Houses
Average List Price
The average list price of houses in 32953, FL, was $600,378 in May 2024, compared to $425,837 in May 2023.
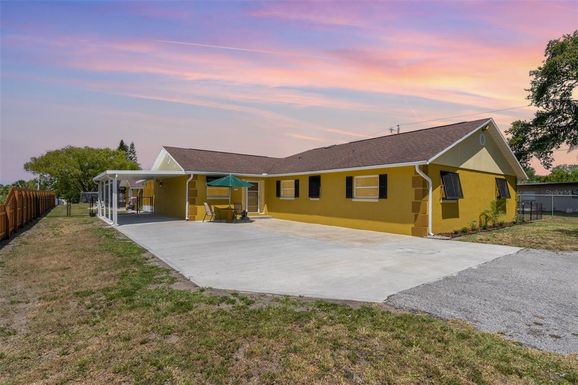
32953, FL Market Trend for Condos / Townhouses / Penthouses
Average List Price
The average list price of condos/co-ops in 32953, FL, was $0 in May 2024, compared to $334,800 in May 2023.
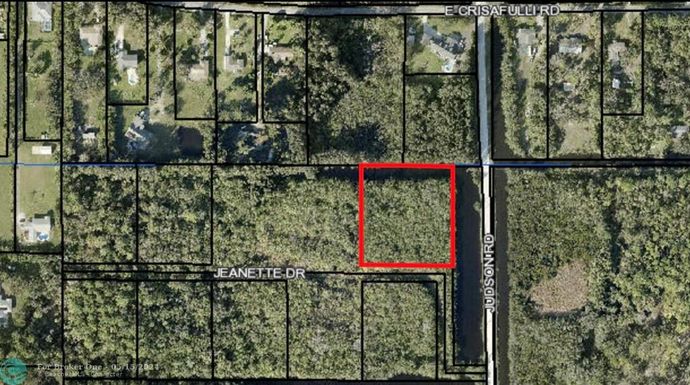
32953, FL Market Trend for Lots/Land
Average List Price
The average list price of lots/land in 32953, FL, was $553,750 in May 2024, compared to $378,833 in May 2023.
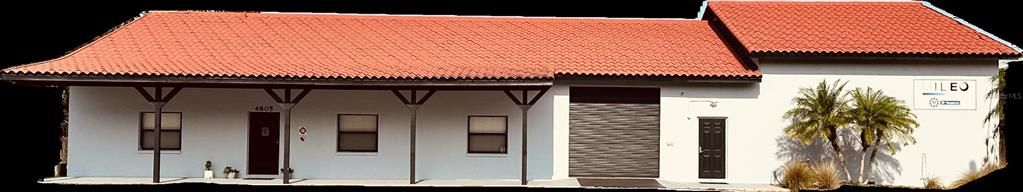
32953, FL Market Trend for Commercial
Average List Price
The average list price of commercial in 32953, FL, was $0 in May 2024, compared to $0 in May 2023.
32953, FL Housing Market Analysis
The average list price in 32953, FL is $512,585. The average list price in 32953, FL went up 20.29% from 2023 to 2024. 32953, FL home resale inventories is 21, which increased 31.25% since 2023. The average list price per square foot in 32953, FL is $239. 2023 it was $234.