In May 2024, 32833, FL homes were selling for an average price of $368,271, 32833, FL homes on average sell after 69 days on the market compared to 57 days last year. There were 249 homes sold in 32833, FL for May 2024, compared to 269 last year.
The average list price of 32833, FL, was $337,404 in May 2024, compared to $308,714 in May 2023.
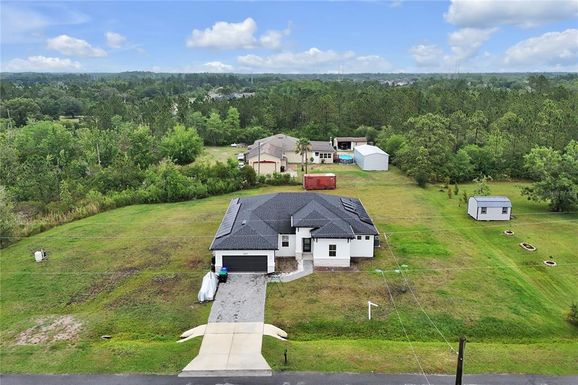
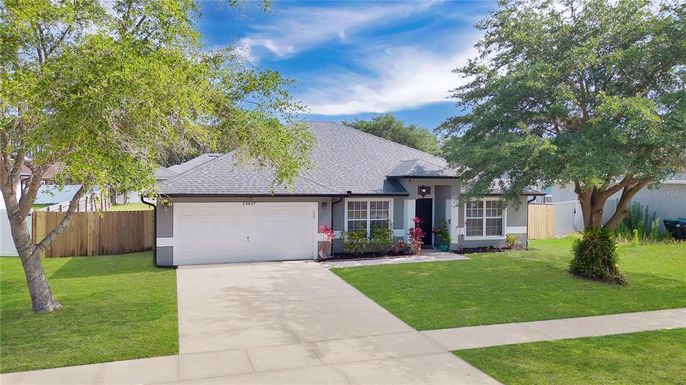
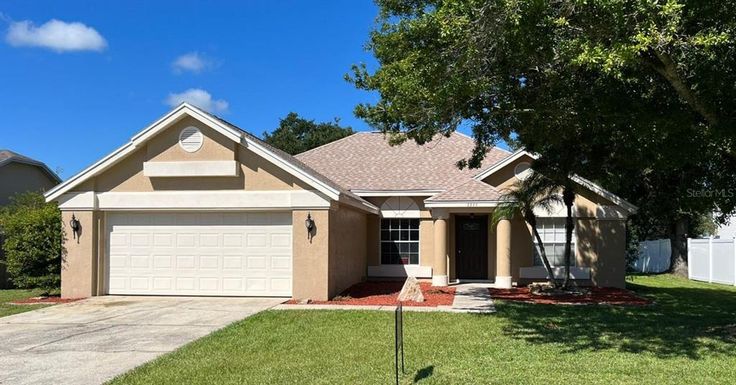
32833, FL Market Trend for Houses
Average List Price
The average list price of houses in 32833, FL, was $703,818 in May 2024, compared to $573,432 in May 2023.
32833, FL Market Trend for Condos / Townhouses / Penthouses
Average List Price
The average list price of condos/co-ops in 32833, FL, was $340,000 in May 2024, compared to $0 in May 2023.
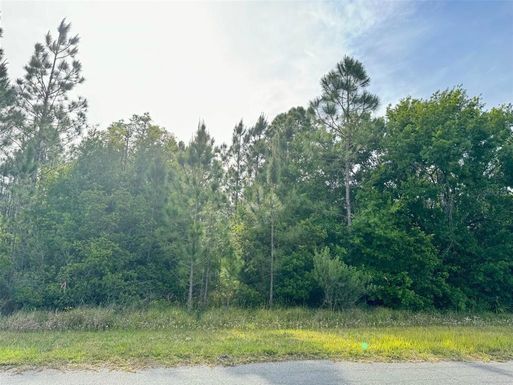
32833, FL Market Trend for Lots/Land
Average List Price
The average list price of lots/land in 32833, FL, was $152,204 in May 2024, compared to $126,416 in May 2023.
32833, FL Market Trend for Commercial
Average List Price
The average list price of commercial in 32833, FL, was $0 in May 2024, compared to $0 in May 2023.
32833, FL Housing Market Analysis
The average list price in 32833, FL is $337,404. The average list price in 32833, FL went up 5.00% from 2023 to 2024. 32833, FL home resale inventories is 133, which increased 51.14% since 2023. The average list price per square foot in 32833, FL is $272. 2023 it was $242.