In May 2024, 32640, FL homes were selling for an average price of $202,435, 32640, FL homes on average sell after 107 days on the market compared to 156 days last year. There were 185 homes sold in 32640, FL for May 2024, compared to 215 last year.
The average list price of 32640, FL, was $246,686 in May 2024, compared to $222,689 in May 2023.
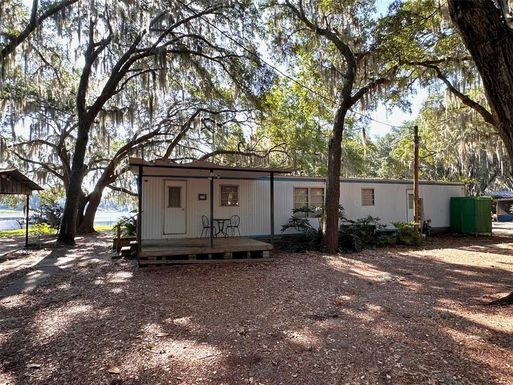
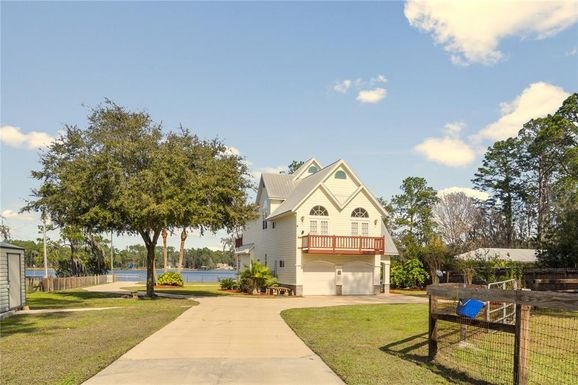
32640, FL Market Trend for Houses
Average List Price
The average list price of houses in 32640, FL, was $434,010 in May 2024, compared to $329,967 in May 2023.
32640, FL Market Trend for Condos / Townhouses / Penthouses
Average List Price
The average list price of condos/co-ops in 32640, FL, was $0 in May 2024, compared to $0 in May 2023.
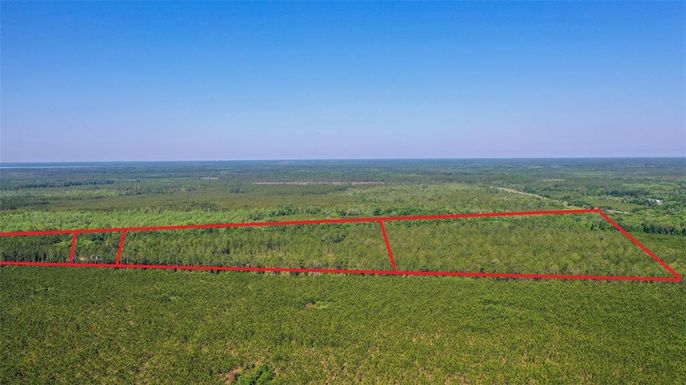
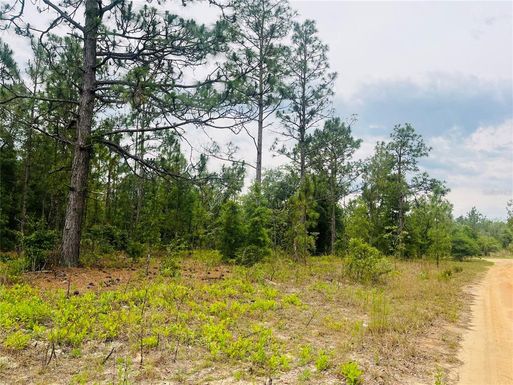
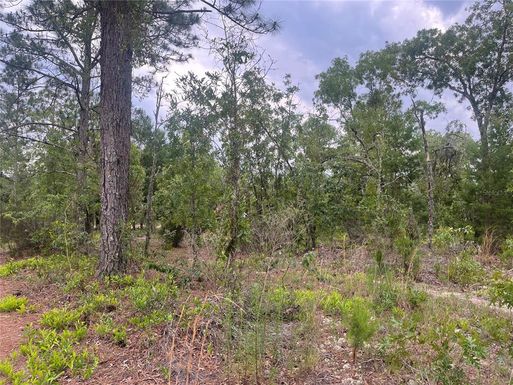
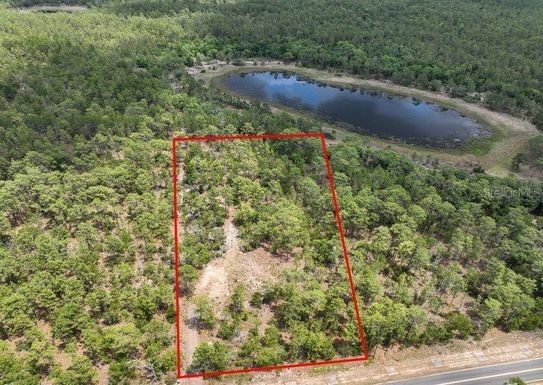
32640, FL Market Trend for Lots/Land
Average List Price
The average list price of lots/land in 32640, FL, was $87,014 in May 2024, compared to $79,489 in May 2023.
32640, FL Market Trend for Commercial
Average List Price
The average list price of commercial in 32640, FL, was $562,086 in May 2024, compared to $520,466 in May 2023.
32640, FL Housing Market Analysis
The average list price in 32640, FL is $246,686. The average list price in 32640, FL went up 15.13% from 2023 to 2024. 32640, FL home resale inventories is 151, which increased 81.93% since 2023. The average list price per square foot in 32640, FL is $248. 2023 it was $182.