In May 2024, 32179, FL homes were selling for an average price of $141,759, 32179, FL homes on average sell after 88 days on the market compared to 81 days last year. There were 540 homes sold in 32179, FL for May 2024, compared to 471 last year.
The average list price of 32179, FL, was $155,911 in May 2024, compared to $118,637 in May 2023.
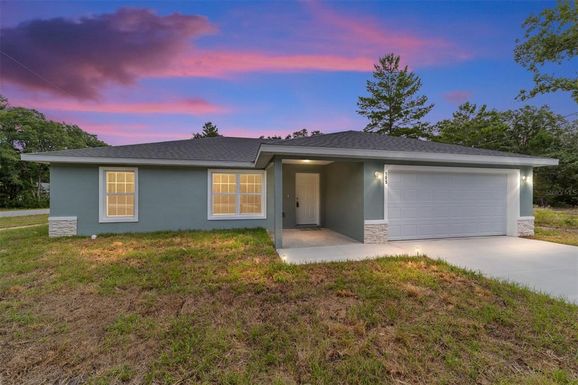
32179, FL Market Trend for Houses
Average List Price
The average list price of houses in 32179, FL, was $363,149 in May 2024, compared to $286,313 in May 2023.
32179, FL Market Trend for Condos / Townhouses / Penthouses
Average List Price
The average list price of condos/co-ops in 32179, FL, was $0 in May 2024, compared to $0 in May 2023.
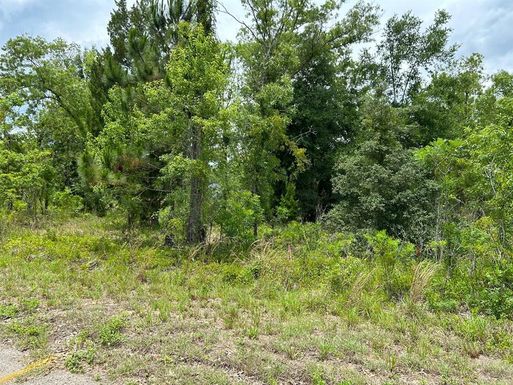
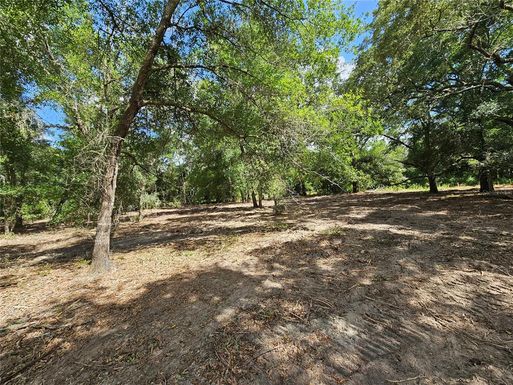
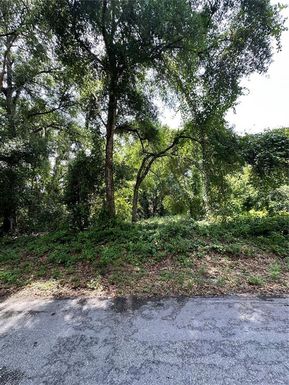
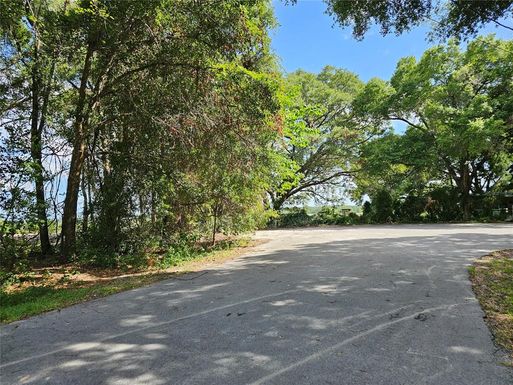
32179, FL Market Trend for Lots/Land
Average List Price
The average list price of lots/land in 32179, FL, was $74,280 in May 2024, compared to $32,097 in May 2023.
32179, FL Market Trend for Commercial
Average List Price
The average list price of commercial in 32179, FL, was $116,438 in May 2024, compared to $23,700 in May 2023.
32179, FL Housing Market Analysis
The average list price in 32179, FL is $155,911. The average list price in 32179, FL went up 29.14% from 2023 to 2024. 32179, FL home resale inventories is 280, which increased 22.27% since 2023. The average list price per square foot in 32179, FL is $199. 2023 it was $177.