In May 2024, 32134, FL homes were selling for an average price of $167,280, 32134, FL homes on average sell after 111 days on the market compared to 86 days last year. There were 249 homes sold in 32134, FL for May 2024, compared to 243 last year.
The average list price of 32134, FL, was $166,321 in May 2024, compared to $178,326 in May 2023.
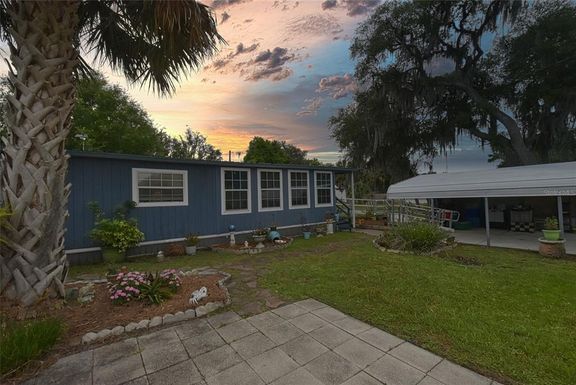
32134, FL Market Trend for Houses
Average List Price
The average list price of houses in 32134, FL, was $424,558 in May 2024, compared to $291,600 in May 2023.
32134, FL Market Trend for Condos / Townhouses / Penthouses
Average List Price
The average list price of condos/co-ops in 32134, FL, was $164,000 in May 2024, compared to $0 in May 2023.
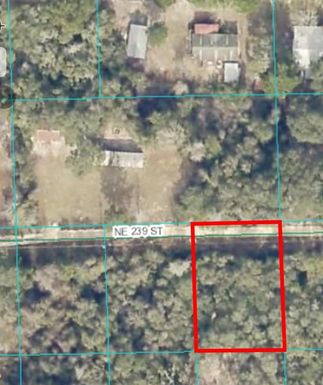
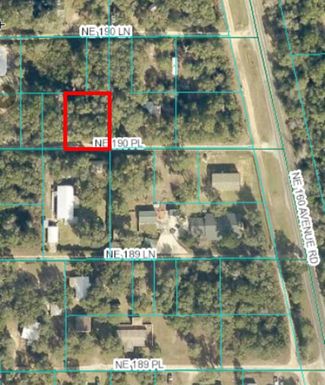
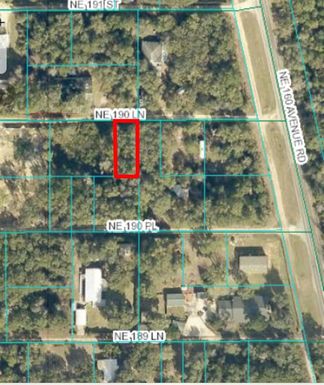
32134, FL Market Trend for Lots/Land
Average List Price
The average list price of lots/land in 32134, FL, was $89,572 in May 2024, compared to $125,715 in May 2023.
32134, FL Market Trend for Commercial
Average List Price
The average list price of commercial in 32134, FL, was $163,100 in May 2024, compared to $197,760 in May 2023.
32134, FL Housing Market Analysis
The average list price in 32134, FL is $166,321. The average list price in 32134, FL went down 7.41% from 2023 to 2024. 32134, FL home resale inventories is 185, which increased 88.78% since 2023. The average list price per square foot in 32134, FL is $225. 2023 it was $170.