In May 2024, 32189, FL homes were selling for an average price of $75,300, 32189, FL homes on average sell after 96 days on the market compared to 72 days last year. There were 54 homes sold in 32189, FL for May 2024, compared to 30 last year.
The average list price of 32189, FL, was $76,589 in May 2024, compared to $58,259 in May 2023.
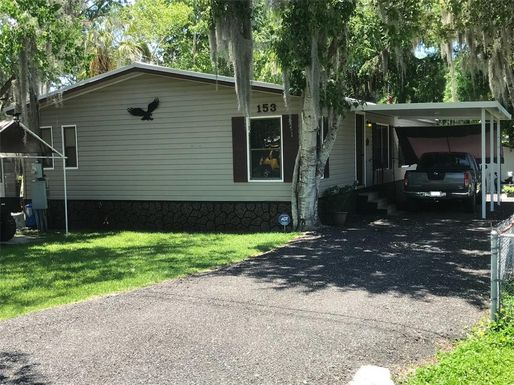
32189, FL Market Trend for Houses
Average List Price
The average list price of houses in 32189, FL, was $271,738 in May 2024, compared to $242,750 in May 2023.
32189, FL Market Trend for Condos / Townhouses / Penthouses
Average List Price
The average list price of condos/co-ops in 32189, FL, was $0 in May 2024, compared to $0 in May 2023.
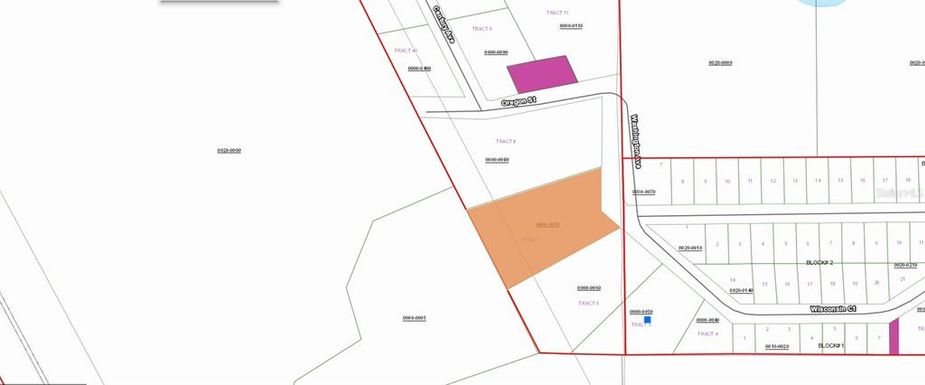
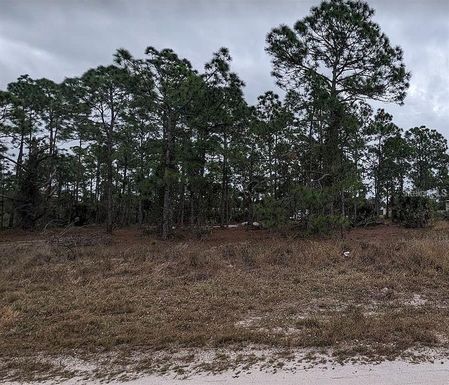
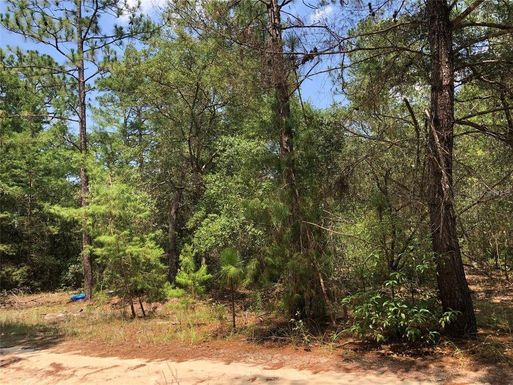
32189, FL Market Trend for Lots/Land
Average List Price
The average list price of lots/land in 32189, FL, was $27,826 in May 2024, compared to $26,205 in May 2023.
32189, FL Market Trend for Commercial
Average List Price
The average list price of commercial in 32189, FL, was $18,900 in May 2024, compared to $6,567 in May 2023.
32189, FL Housing Market Analysis
The average list price in 32189, FL is $76,589. The average list price in 32189, FL went up 48.47% from 2023 to 2024. 32189, FL home resale inventories is 63, which increased 117.24% since 2023. The average list price per square foot in 32189, FL is $188. 2023 it was $155.