In May 2024, Oxford, FL homes were selling for an average price of $426,792, Oxford, FL homes on average sell after 59 days on the market compared to 70 days last year. There were 141 homes sold in Oxford, FL for May 2024, compared to 118 last year.
The average list price of Oxford, FL, was $671,989 in May 2024, compared to $750,767 in May 2023.
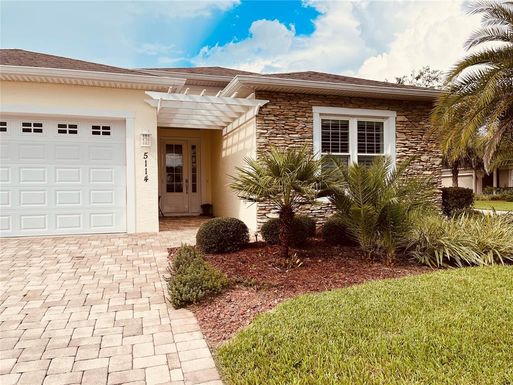
Oxford, FL Market Trend for Houses
Average List Price
The average list price of houses in Oxford, FL, was $444,559 in May 2024, compared to $422,001 in May 2023.
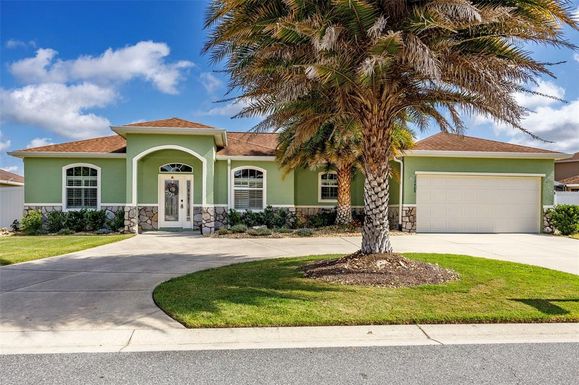
Oxford, FL Market Trend for Condos / Townhouses / Penthouses
Average List Price
The average list price of condos/co-ops in Oxford, FL, was $235,000 in May 2024, compared to $235,360 in May 2023.
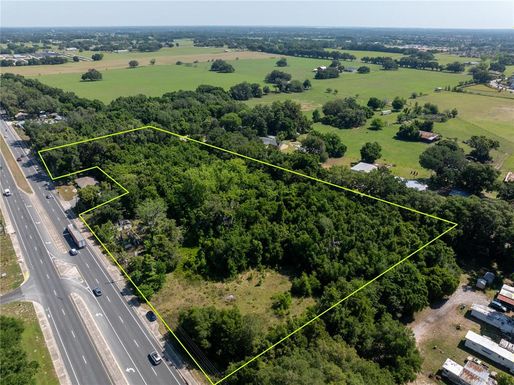
Oxford, FL Market Trend for Lots/Land
Average List Price
The average list price of lots/land in Oxford, FL, was $1,492,347 in May 2024, compared to $1,906,745 in May 2023.
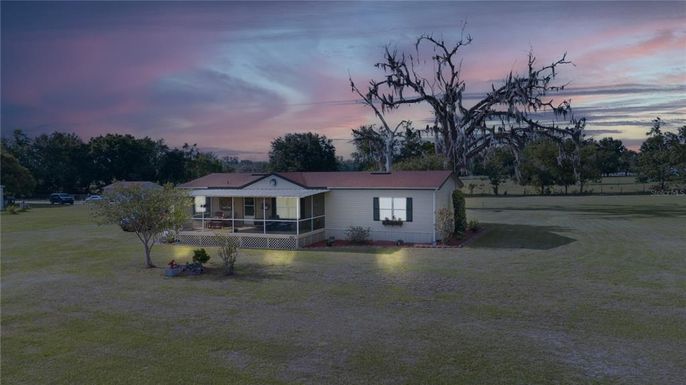
Oxford, FL Market Trend for Commercial
Average List Price
The average list price of commercial in Oxford, FL, was $371,058 in May 2024, compared to $301,164 in May 2023.
Oxford, FL Housing Market Analysis
The average list price in Oxford, FL is $671,989. The average list price in Oxford, FL went down 0.40% from 2023 to 2024. Oxford, FL home resale inventories is 83, which increased 59.62% since 2023. The average list price per square foot in Oxford, FL is $236. 2023 it was $5,961.