In May 2024, Fruitland Park, FL homes were selling for an average price of $351,798, Fruitland Park, FL homes on average sell after 70 days on the market compared to 55 days last year. There were 215 homes sold in Fruitland Park, FL for May 2024, compared to 207 last year.
The average list price of Fruitland Park, FL, was $766,242 in May 2024, compared to $740,541 in May 2023.
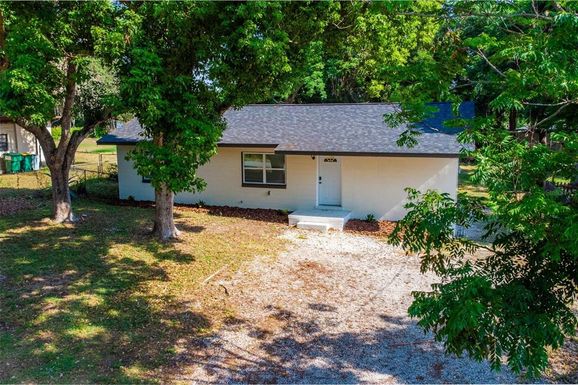
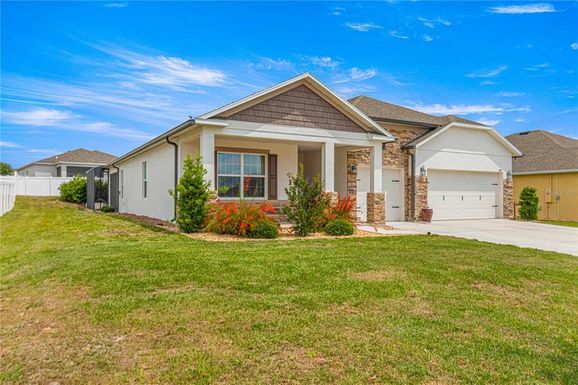
Fruitland Park, FL Market Trend for Houses
Average List Price
The average list price of houses in Fruitland Park, FL, was $410,801 in May 2024, compared to $368,767 in May 2023.
Fruitland Park, FL Market Trend for Condos / Townhouses / Penthouses
Average List Price
The average list price of condos/co-ops in Fruitland Park, FL, was $0 in May 2024, compared to $0 in May 2023.
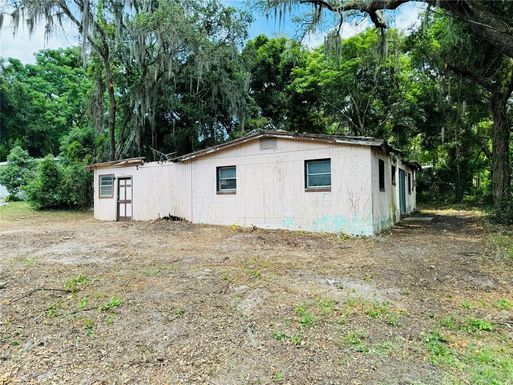
Fruitland Park, FL Market Trend for Lots/Land
Average List Price
The average list price of lots/land in Fruitland Park, FL, was $1,568,511 in May 2024, compared to $1,977,275 in May 2023.
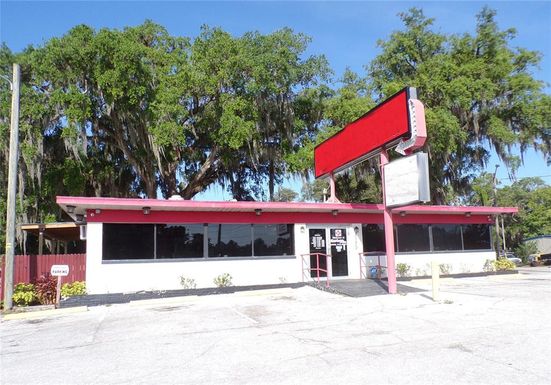
Fruitland Park, FL Market Trend for Commercial
Average List Price
The average list price of commercial in Fruitland Park, FL, was $969,843 in May 2024, compared to $437,598 in May 2023.
Fruitland Park, FL Housing Market Analysis
The average list price in Fruitland Park, FL is $766,242. The average list price in Fruitland Park, FL went down 1.54% from 2023 to 2024. Fruitland Park, FL home resale inventories is 94, which increased 40.30% since 2023. The average list price per square foot in Fruitland Park, FL is $219. 2023 it was $190.