In May 2024, Ocklawaha, FL homes were selling for an average price of $142,012, Ocklawaha, FL homes on average sell after 86 days on the market compared to 79 days last year. There were 524 homes sold in Ocklawaha, FL for May 2024, compared to 469 last year.
The average list price of Ocklawaha, FL, was $160,932 in May 2024, compared to $124,888 in May 2023.
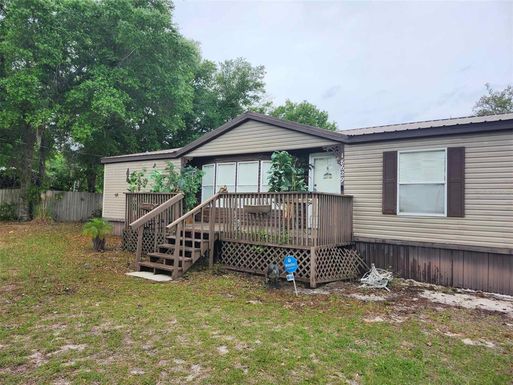
Ocklawaha, FL Market Trend for Houses
Average List Price
The average list price of houses in Ocklawaha, FL, was $363,659 in May 2024, compared to $284,914 in May 2023.
Ocklawaha, FL Market Trend for Condos / Townhouses / Penthouses
Average List Price
The average list price of condos/co-ops in Ocklawaha, FL, was $0 in May 2024, compared to $0 in May 2023.
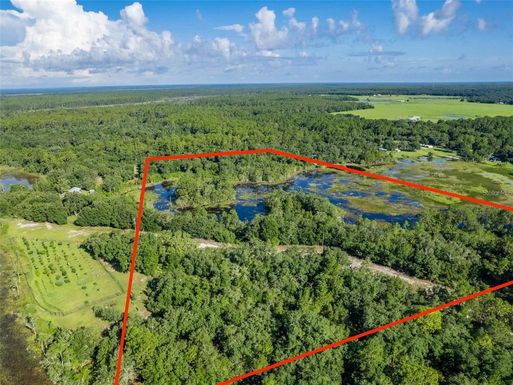
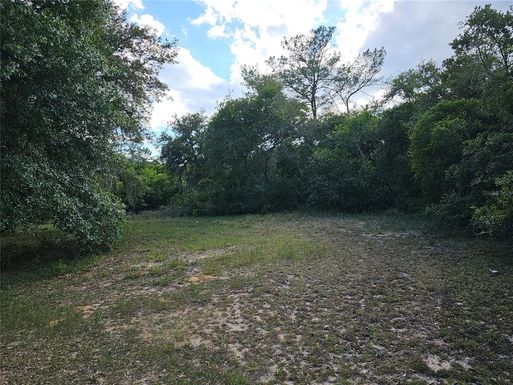
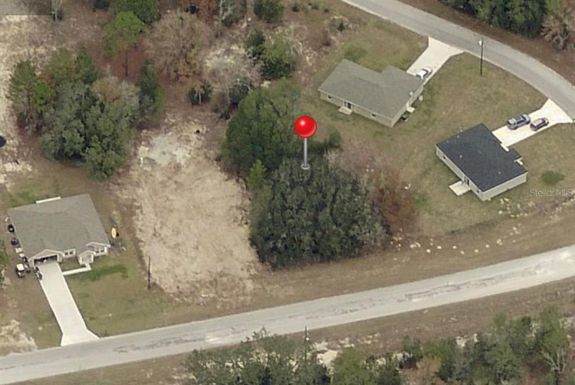
Ocklawaha, FL Market Trend for Lots/Land
Average List Price
The average list price of lots/land in Ocklawaha, FL, was $77,334 in May 2024, compared to $33,548 in May 2023.
Ocklawaha, FL Market Trend for Commercial
Average List Price
The average list price of commercial in Ocklawaha, FL, was $129,686 in May 2024, compared to $0 in May 2023.
Ocklawaha, FL Housing Market Analysis
The average list price in Ocklawaha, FL is $160,932. The average list price in Ocklawaha, FL went up 33.76% from 2023 to 2024. Ocklawaha, FL home resale inventories is 271, which increased 17.83% since 2023. The average list price per square foot in Ocklawaha, FL is $196. 2023 it was $177.