In May 2024, Inverness, FL homes were selling for an average price of $229,424, Inverness, FL homes on average sell after 78 days on the market compared to 52 days last year. There were 395 homes sold in Inverness, FL for May 2024, compared to 392 last year.
The average list price of Inverness, FL, was $199,822 in May 2024, compared to $185,236 in May 2023.
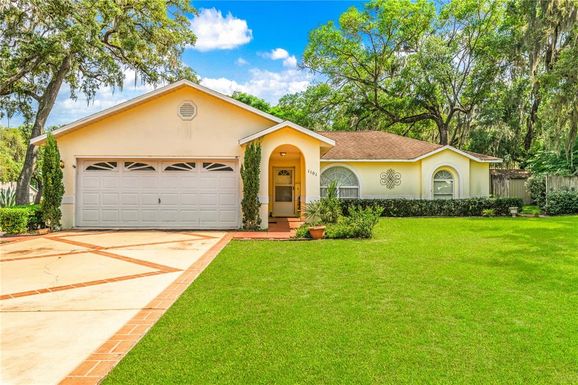
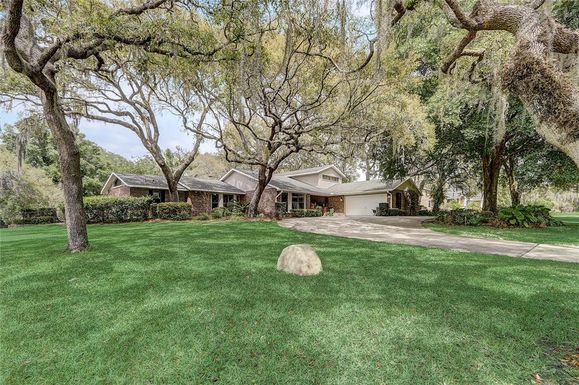
Inverness, FL Market Trend for Houses
Average List Price
The average list price of houses in Inverness, FL, was $337,267 in May 2024, compared to $321,016 in May 2023.
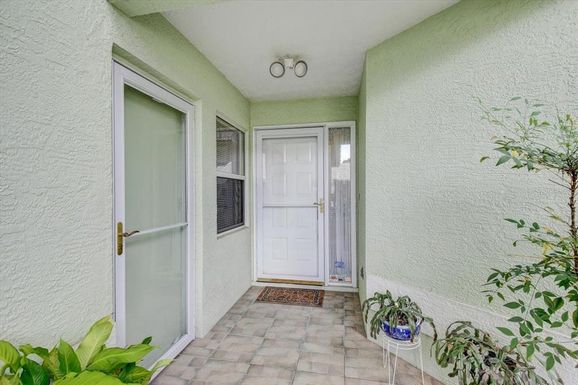
Inverness, FL Market Trend for Condos / Townhouses / Penthouses
Average List Price
The average list price of condos/co-ops in Inverness, FL, was $233,063 in May 2024, compared to $187,500 in May 2023.
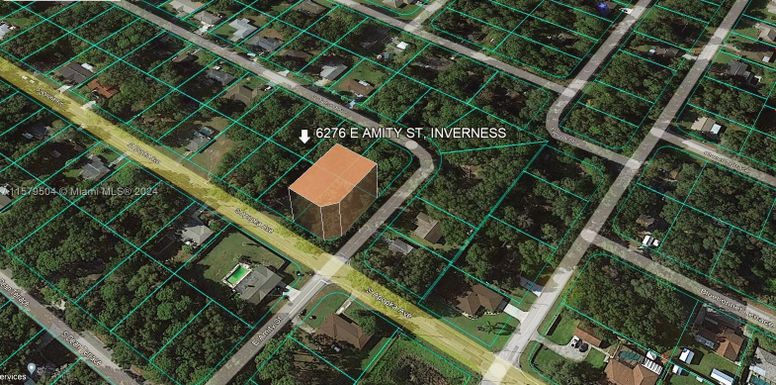
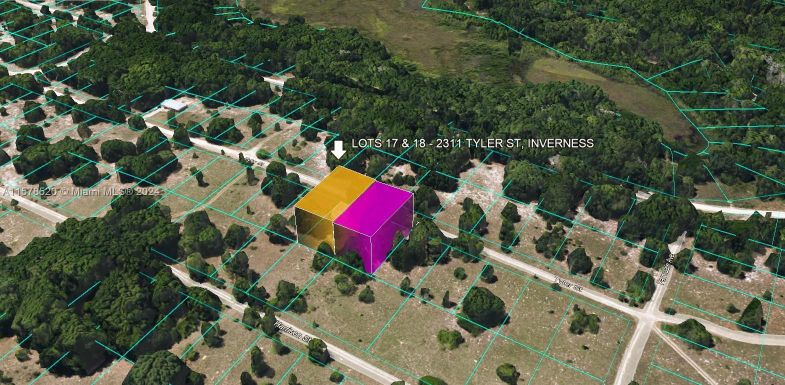
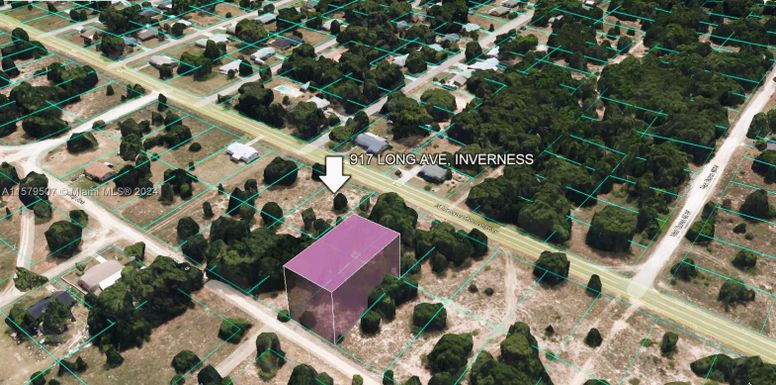
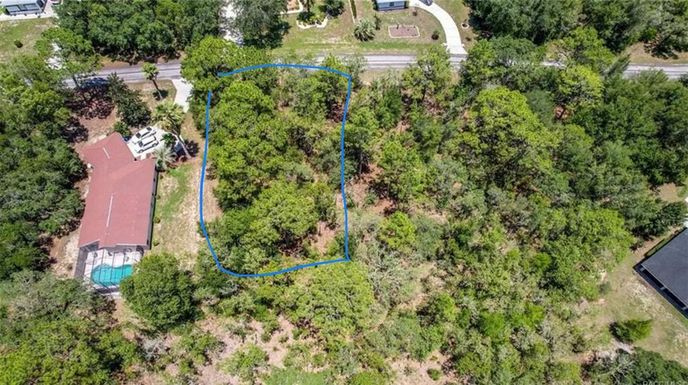
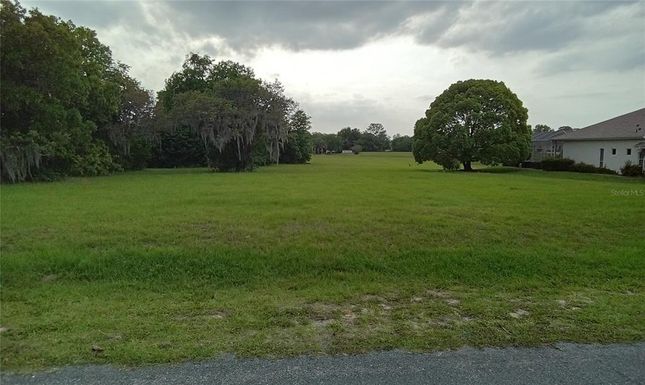
Inverness, FL Market Trend for Lots/Land
Average List Price
The average list price of lots/land in Inverness, FL, was $48,552 in May 2024, compared to $88,963 in May 2023.
Inverness, FL Market Trend for Commercial
Average List Price
The average list price of commercial in Inverness, FL, was $296,953 in May 2024, compared to $90,785 in May 2023.
Inverness, FL Housing Market Analysis
The average list price in Inverness, FL is $199,822. The average list price in Inverness, FL went up 3.03% from 2023 to 2024. Inverness, FL home resale inventories is 258, which increased 95.45% since 2023. The average list price per square foot in Inverness, FL is $202. 2023 it was $189.