In May 2024, Daytona Beach, FL homes were selling for an average price of $375,372, Daytona Beach, FL homes on average sell after 65 days on the market compared to 44 days last year. There were 911 homes sold in Daytona Beach, FL for May 2024, compared to 824 last year.
The average list price of Daytona Beach, FL, was $429,845 in May 2024, compared to $359,610 in May 2023.
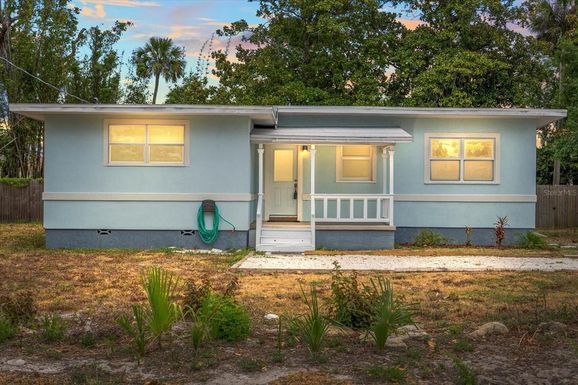
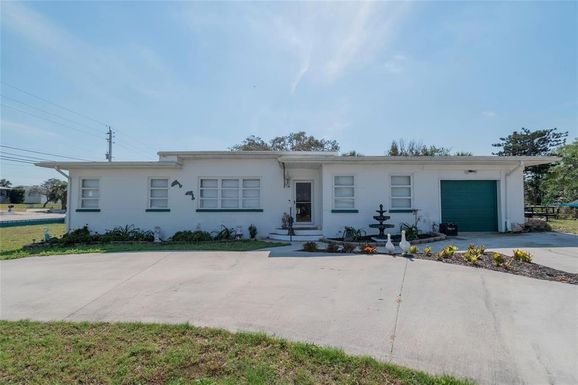
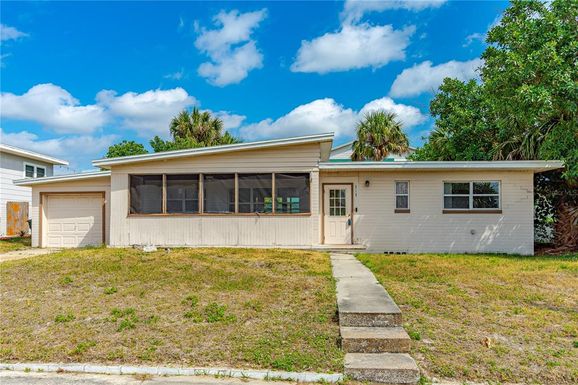
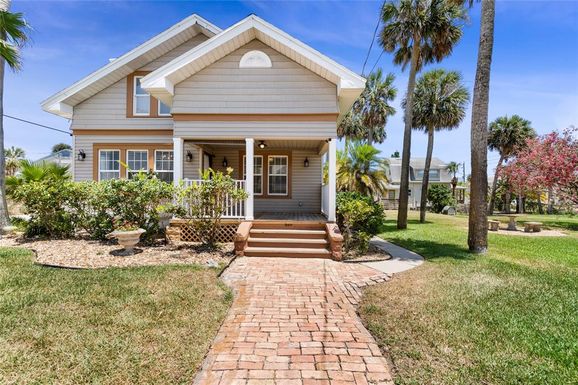
Daytona Beach, FL Market Trend for Houses
Average List Price
The average list price of houses in Daytona Beach, FL, was $492,926 in May 2024, compared to $378,617 in May 2023.
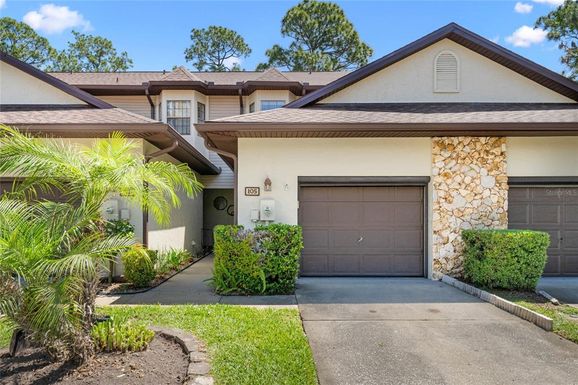
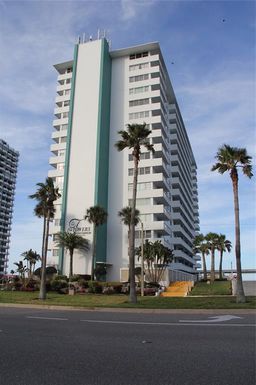
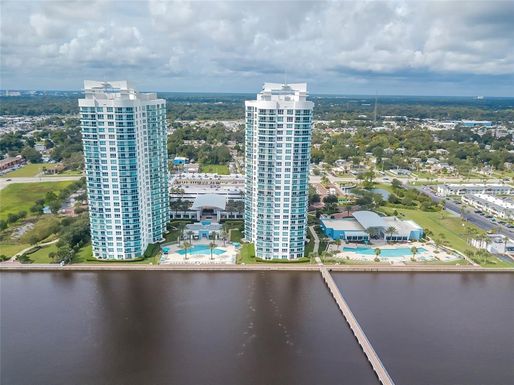
Daytona Beach, FL Market Trend for Condos / Townhouses / Penthouses
Average List Price
The average list price of condos/co-ops in Daytona Beach, FL, was $366,370 in May 2024, compared to $386,802 in May 2023.
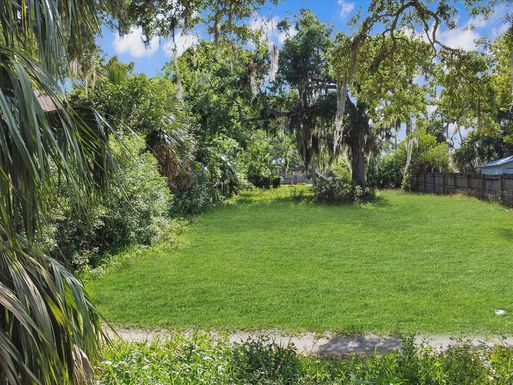
Daytona Beach, FL Market Trend for Lots/Land
Average List Price
The average list price of lots/land in Daytona Beach, FL, was $306,103 in May 2024, compared to $345,442 in May 2023.
Daytona Beach, FL Market Trend for Commercial
Average List Price
The average list price of commercial in Daytona Beach, FL, was $1,235,442 in May 2024, compared to $580,029 in May 2023.
Daytona Beach, FL Housing Market Analysis
The average list price in Daytona Beach, FL is $429,845. The average list price in Daytona Beach, FL went up 15.25% from 2023 to 2024. Daytona Beach, FL home resale inventories is 585, which increased 96.97% since 2023. The average list price per square foot in Daytona Beach, FL is $295. 2023 it was $267.