In May 2024, Deland, FL homes were selling for an average price of $350,097, Deland, FL homes on average sell after 61 days on the market compared to 54 days last year. There were 1621 homes sold in Deland, FL for May 2024, compared to 1774 last year.
The average list price of Deland, FL, was $391,030 in May 2024, compared to $392,615 in May 2023.
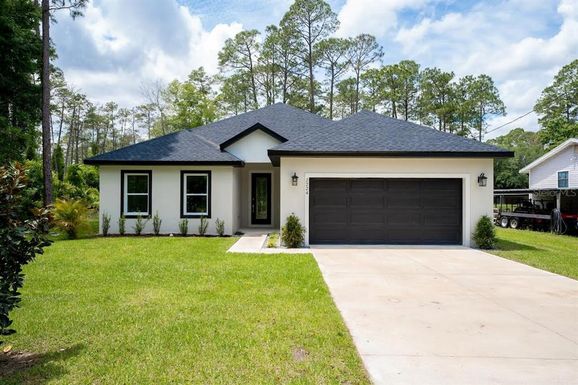
Deland, FL Market Trend for Houses
Average List Price
The average list price of houses in Deland, FL, was $427,705 in May 2024, compared to $406,139 in May 2023.
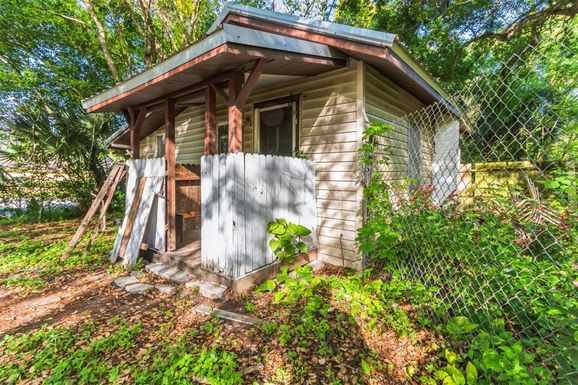
Deland, FL Market Trend for Condos / Townhouses / Penthouses
Average List Price
The average list price of condos/co-ops in Deland, FL, was $237,662 in May 2024, compared to $210,284 in May 2023.
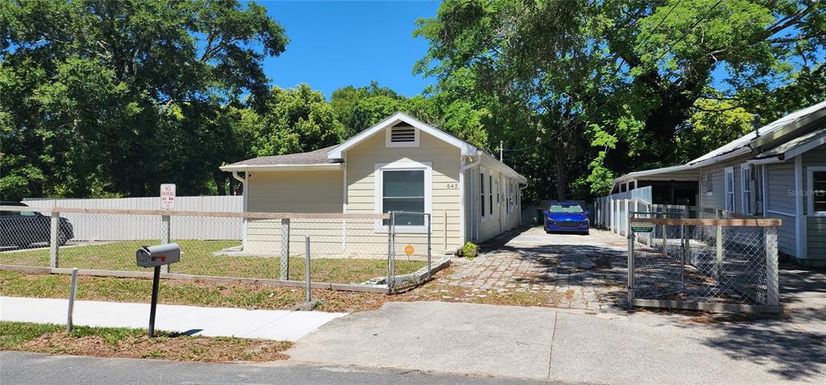
Deland, FL Market Trend for Lots/Land
Average List Price
The average list price of lots/land in Deland, FL, was $280,665 in May 2024, compared to $402,745 in May 2023.
Deland, FL Market Trend for Commercial
Average List Price
The average list price of commercial in Deland, FL, was $690,979 in May 2024, compared to $609,164 in May 2023.
Deland, FL Housing Market Analysis
The average list price in Deland, FL is $391,030. The average list price in Deland, FL went up 2.84% from 2023 to 2024. Deland, FL home resale inventories is 539, which increased 11.36% since 2023. The average list price per square foot in Deland, FL is $218. 2023 it was $200.