In May 2024, Branford, FL homes were selling for an average price of $187,016, Branford, FL homes on average sell after 72 days on the market compared to 78 days last year. There were 43 homes sold in Branford, FL for May 2024, compared to 41 last year.
The average list price of Branford, FL, was $508,012 in May 2024, compared to $198,100 in May 2023.
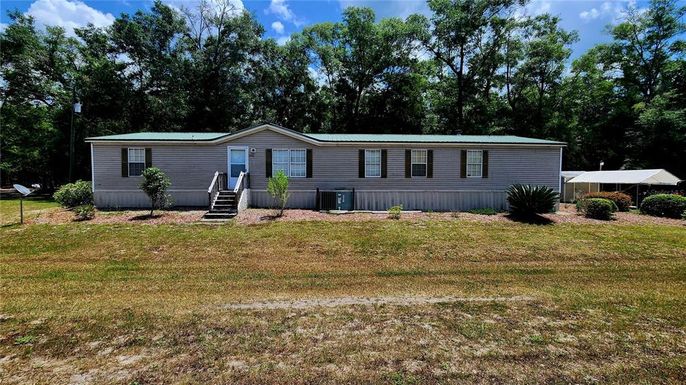
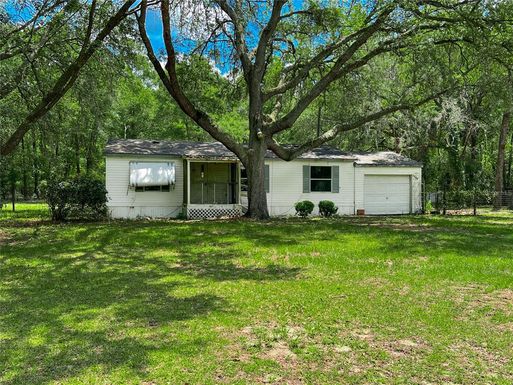
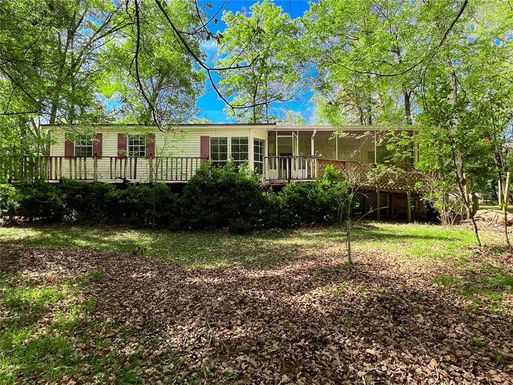
Branford, FL Market Trend for Houses
Average List Price
The average list price of houses in Branford, FL, was $1,052,483 in May 2024, compared to $505,000 in May 2023.
Branford, FL Market Trend for Condos / Townhouses / Penthouses
Average List Price
The average list price of condos/co-ops in Branford, FL, was $0 in May 2024, compared to $0 in May 2023.
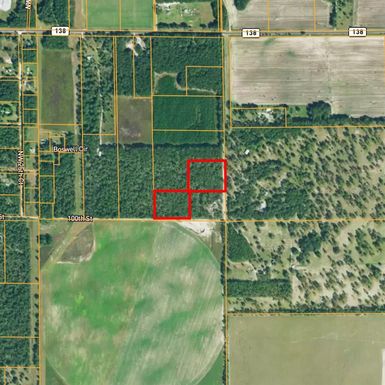
Branford, FL Market Trend for Lots/Land
Average List Price
The average list price of lots/land in Branford, FL, was $353,969 in May 2024, compared to $122,400 in May 2023.
Branford, FL Market Trend for Commercial
Average List Price
The average list price of commercial in Branford, FL, was $1,050,000 in May 2024, compared to $0 in May 2023.
Branford, FL Housing Market Analysis
The average list price in Branford, FL is $508,012. The average list price in Branford, FL went up 99.32% from 2023 to 2024. Branford, FL home resale inventories is 25, which increased 177.78% since 2023. The average list price per square foot in Branford, FL is $359. 2023 it was $241.