In May 2024, Bell, FL homes were selling for an average price of $439,252, Bell, FL homes on average sell after 84 days on the market compared to 60 days last year. There were 1120 homes sold in Bell, FL for May 2024, compared to 1081 last year.
The average list price of Bell, FL, was $644,270 in May 2024, compared to $552,791 in May 2023.
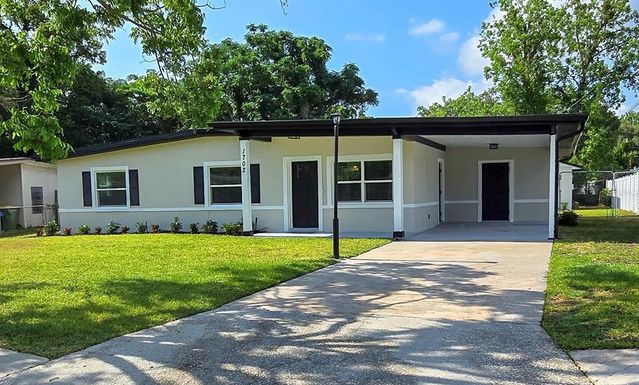
Bell, FL Market Trend for Houses
Average List Price
The average list price of houses in Bell, FL, was $644,723 in May 2024, compared to $542,038 in May 2023.
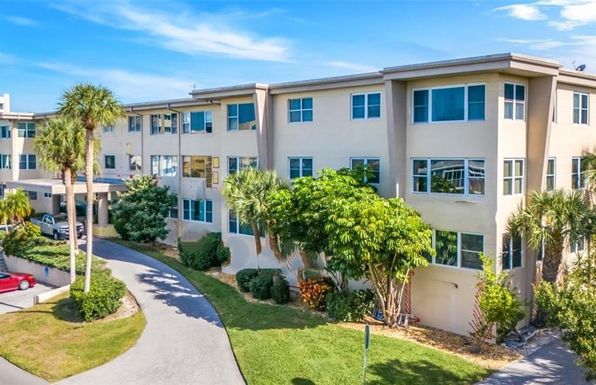
Bell, FL Market Trend for Condos / Townhouses / Penthouses
Average List Price
The average list price of condos/co-ops in Bell, FL, was $582,363 in May 2024, compared to $495,741 in May 2023.
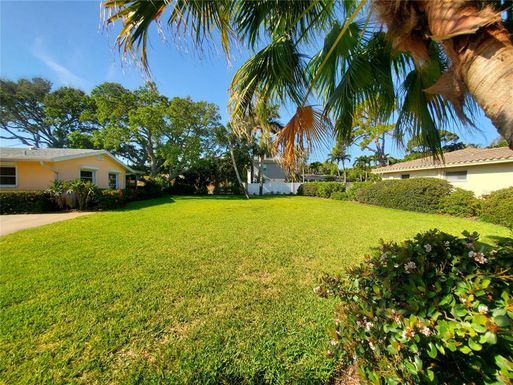
Bell, FL Market Trend for Lots/Land
Average List Price
The average list price of lots/land in Bell, FL, was $394,575 in May 2024, compared to $377,352 in May 2023.
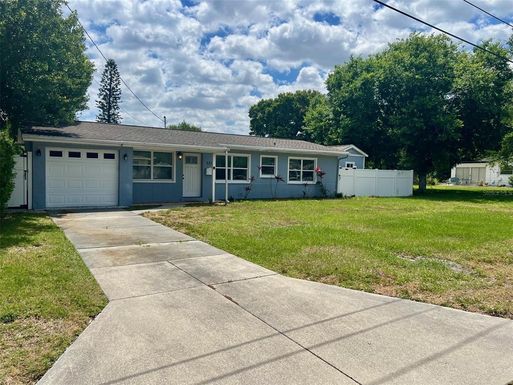
Bell, FL Market Trend for Commercial
Average List Price
The average list price of commercial in Bell, FL, was $1,512,261 in May 2024, compared to $1,438,513 in May 2023.
Bell, FL Housing Market Analysis
The average list price in Bell, FL is $644,270. The average list price in Bell, FL went up 10.35% from 2023 to 2024. Bell, FL home resale inventories is 539, which increased 48.48% since 2023. The average list price per square foot in Bell, FL is $303. 2023 it was $254.