In May 2024, 32179, FL homes were selling for an average price of $107,169, 32179, FL homes on average sell after 106 days on the market compared to 155 days last year. There were 55 homes sold in 32179, FL for May 2024, compared to 19 last year.
The average list price of 32179, FL, was $193,393 in May 2024, compared to $47,325 in May 2023.
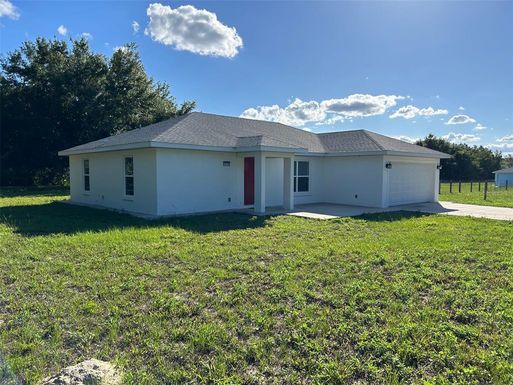
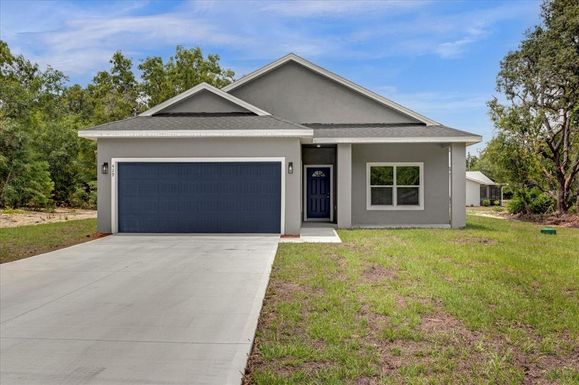
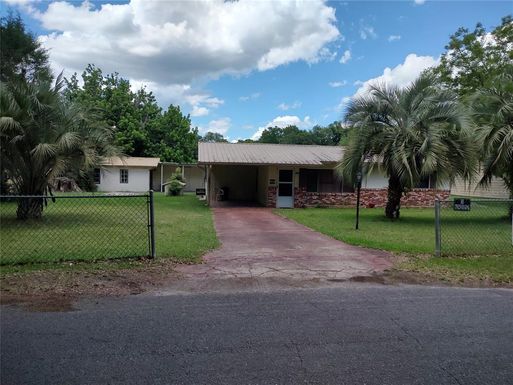
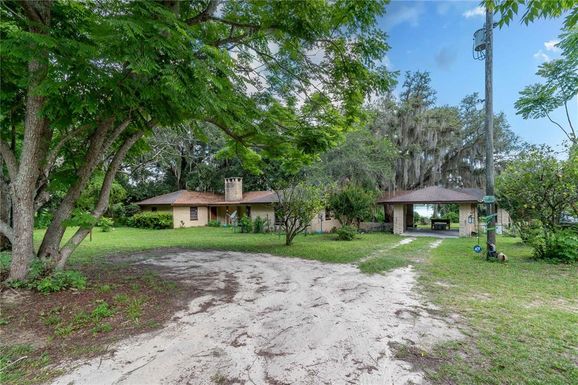
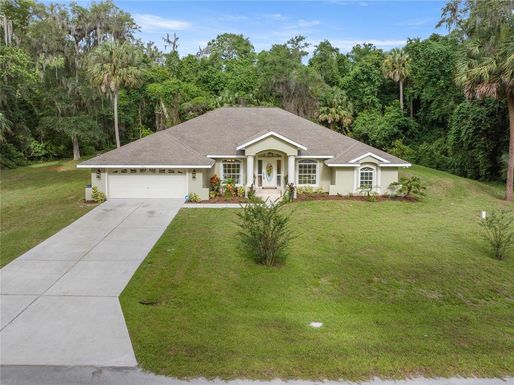
32179, FL Market Trend for Houses
Average List Price
The average list price of houses in 32179, FL, was $327,743 in May 2024, compared to $249,000 in May 2023.
32179, FL Market Trend for Condos / Townhouses / Penthouses
Average List Price
The average list price of condos/co-ops in 32179, FL, was $0 in May 2024, compared to $0 in May 2023.
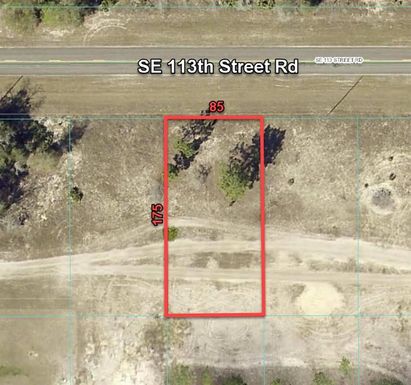
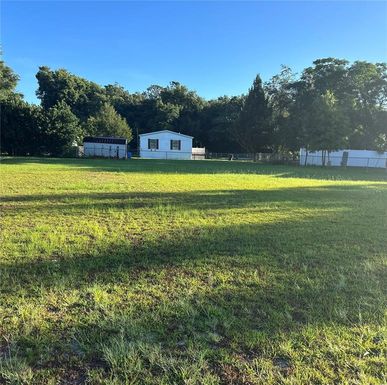
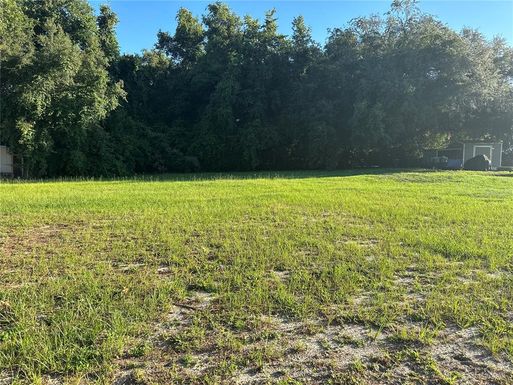
32179, FL Market Trend for Lots/Land
Average List Price
The average list price of lots/land in 32179, FL, was $65,189 in May 2024, compared to $17,650 in May 2023.
32179, FL Market Trend for Commercial
Average List Price
The average list price of commercial in 32179, FL, was $27,267 in May 2024, compared to $23,700 in May 2023.
32179, FL Housing Market Analysis
The average list price in 32179, FL is $193,393. The average list price in 32179, FL went up 308.65% from 2023 to 2024. 32179, FL home resale inventories is 97, which increased 1112.50% since 2023. The average list price per square foot in 32179, FL is $205. 2023 it was $176.