In May 2024, Seminole, FL homes were selling for an average price of $446,158, Seminole, FL homes on average sell after 37 days on the market compared to 26 days last year. There were 998 homes sold in Seminole, FL for May 2024, compared to 1033 last year.
The average list price of Seminole, FL, was $494,439 in May 2024, compared to $455,897 in May 2023.
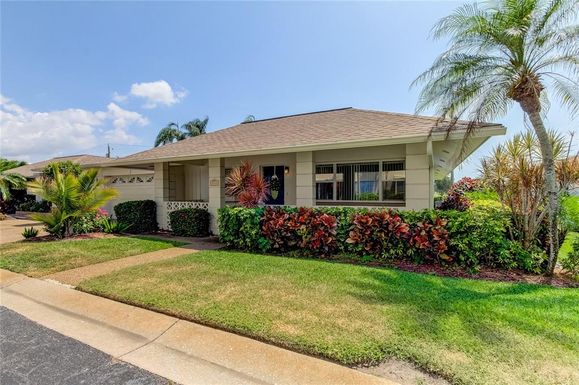
Seminole, FL Market Trend for Houses
Average List Price
The average list price of houses in Seminole, FL, was $604,139 in May 2024, compared to $547,391 in May 2023.
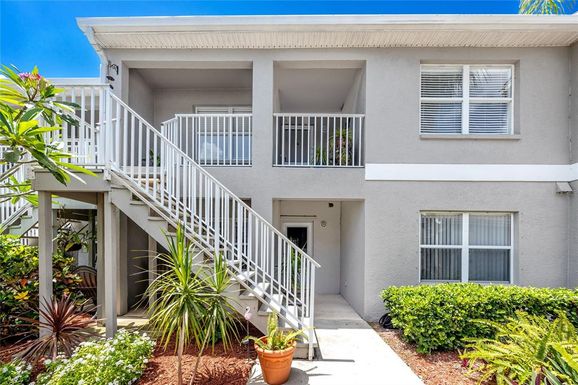
Seminole, FL Market Trend for Condos / Townhouses / Penthouses
Average List Price
The average list price of condos/co-ops in Seminole, FL, was $298,651 in May 2024, compared to $262,417 in May 2023.
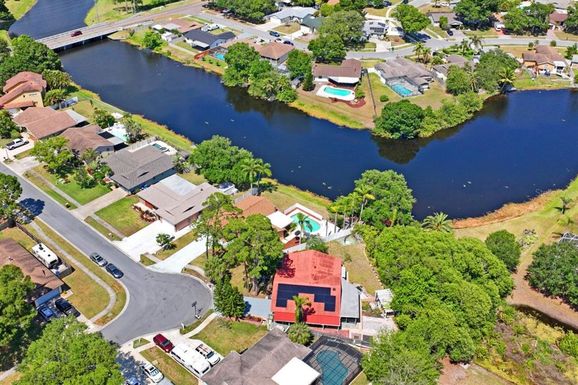
Seminole, FL Market Trend for Lots/Land
Average List Price
The average list price of lots/land in Seminole, FL, was $1,319,211 in May 2024, compared to $582,912 in May 2023.
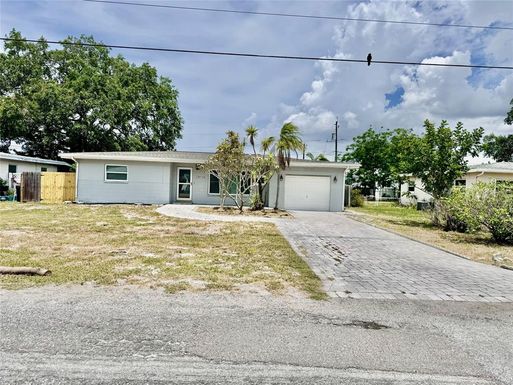
Seminole, FL Market Trend for Commercial
Average List Price
The average list price of commercial in Seminole, FL, was $510,048 in May 2024, compared to $475,048 in May 2023.
Seminole, FL Housing Market Analysis
The average list price in Seminole, FL is $494,439. The average list price in Seminole, FL went up 7.87% from 2023 to 2024. Seminole, FL home resale inventories is 329, which increased 77.84% since 2023. The average list price per square foot in Seminole, FL is $270. 2023 it was $265.