In May 2024, 34953, FL homes were selling for an average price of $383,058, 34953, FL homes on average sell after 59 days on the market compared to 52 days last year. There were 2098 homes sold in 34953, FL for May 2024, compared to 2477 last year.
The average list price of 34953, FL, was $464,859 in May 2024, compared to $380,173 in May 2023.
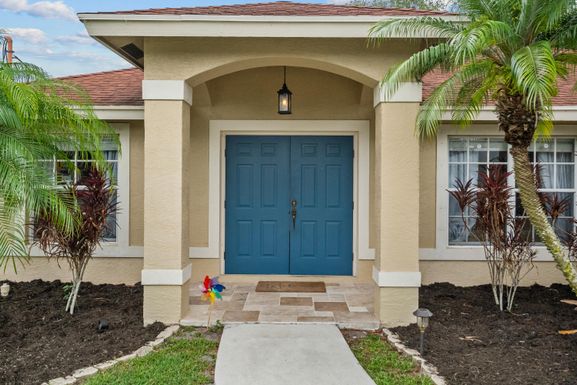
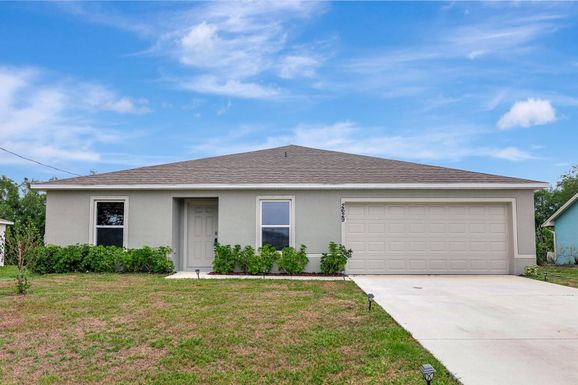
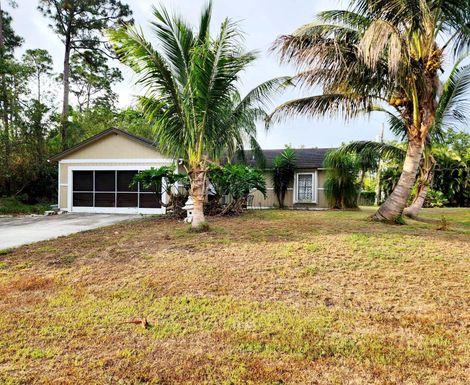
34953, FL Market Trend for Houses
Average List Price
The average list price of houses in 34953, FL, was $479,264 in May 2024, compared to $427,591 in May 2023.
34953, FL Market Trend for Condos / Townhouses / Penthouses
Average List Price
The average list price of condos/co-ops in 34953, FL, was $284,543 in May 2024, compared to $293,100 in May 2023.
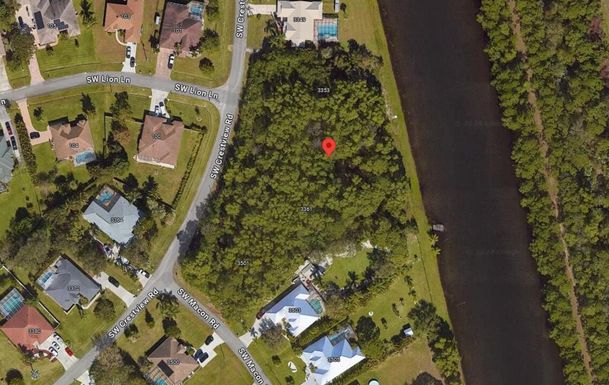
34953, FL Market Trend for Lots/Land
Average List Price
The average list price of lots/land in 34953, FL, was $185,741 in May 2024, compared to $115,963 in May 2023.
34953, FL Market Trend for Commercial
Average List Price
The average list price of commercial in 34953, FL, was $437,977 in May 2024, compared to $191,184 in May 2023.
34953, FL Housing Market Analysis
The average list price in 34953, FL is $464,859. The average list price in 34953, FL went up 22.30% from 2023 to 2024. 34953, FL home resale inventories is 471, which decreased 13.42% since 2023. The average list price per square foot in 34953, FL is $250. 2023 it was $228.