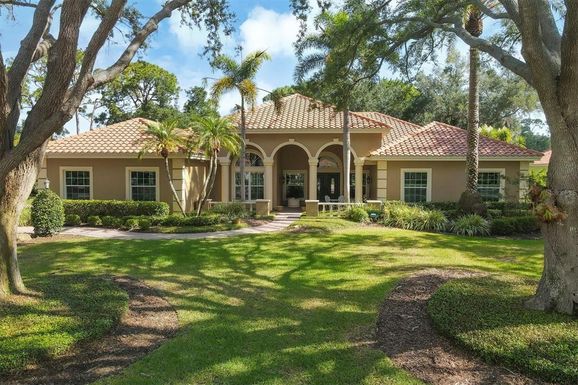
In May 2024, 34238, FL homes were selling for an average price of $649,182, 34238, FL homes on average sell after 56 days on the market compared to 29 days last year. There were 652 homes sold in 34238, FL for May 2024, compared to 811 last year.
The average list price of 34238, FL, was $637,667 in May 2024, compared to $662,671 in May 2023.
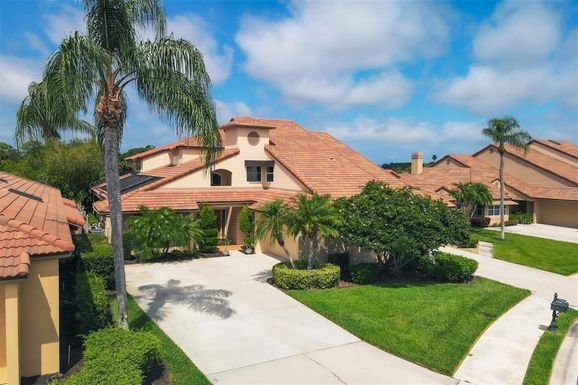
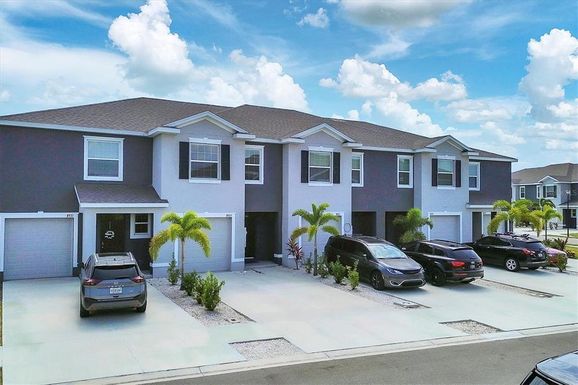
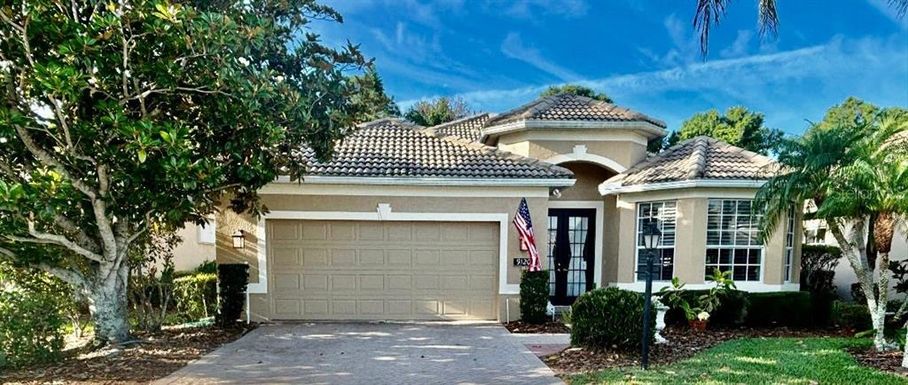
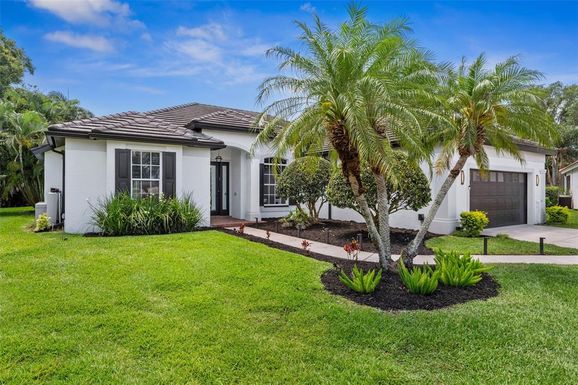
34238, FL Market Trend for Houses
Average List Price
The average list price of houses in 34238, FL, was $806,372 in May 2024, compared to $833,524 in May 2023.
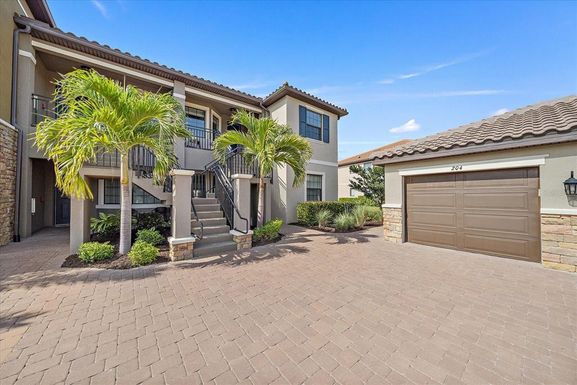
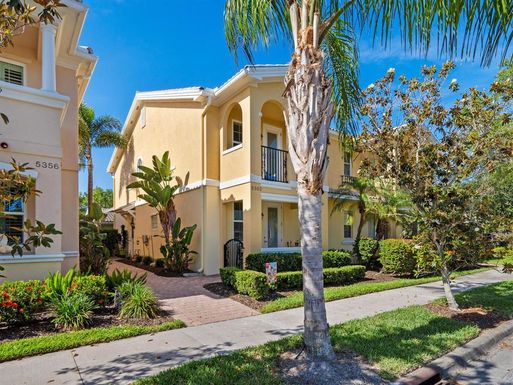
34238, FL Market Trend for Condos / Townhouses / Penthouses
Average List Price
The average list price of condos/co-ops in 34238, FL, was $397,196 in May 2024, compared to $356,561 in May 2023.
34238, FL Market Trend for Lots/Land
Average List Price
The average list price of lots/land in 34238, FL, was $0 in May 2024, compared to $0 in May 2023.
34238, FL Market Trend for Commercial
Average List Price
The average list price of commercial in 34238, FL, was $550,000 in May 2024, compared to $149,900 in May 2023.
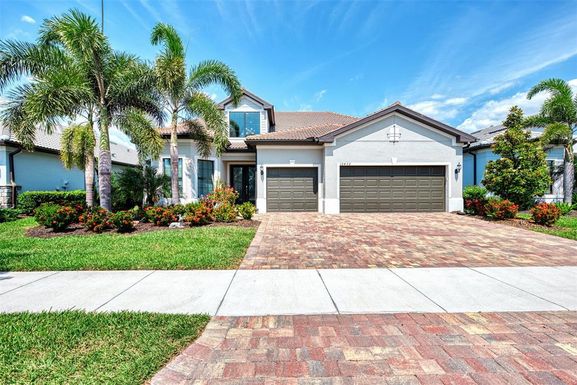
34238, FL Housing Market Analysis
The average list price in 34238, FL is $637,667. The average list price in 34238, FL went down 5.73% from 2023 to 2024. 34238, FL home resale inventories is 258, which increased 46.59% since 2023. The average list price per square foot in 34238, FL is $309. 2023 it was $300.