In May 2024, 33469, FL homes were selling for an average price of $1,901,456, 33469, FL homes on average sell after 82 days on the market compared to 56 days last year. There were 454 homes sold in 33469, FL for May 2024, compared to 409 last year.
The average list price of 33469, FL, was $2,332,447 in May 2024, compared to $2,897,506 in May 2023.
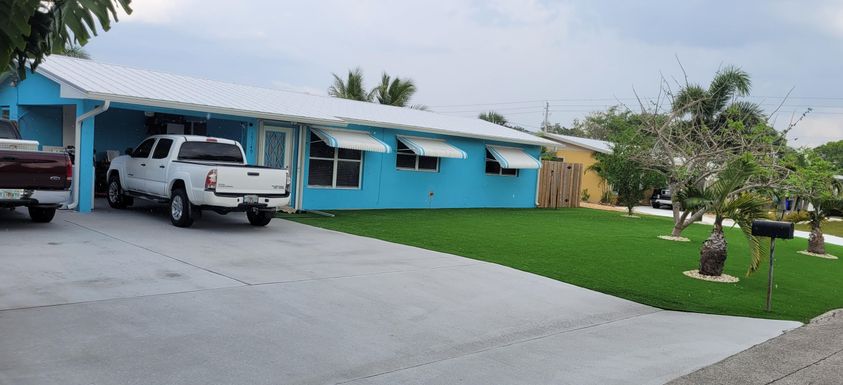
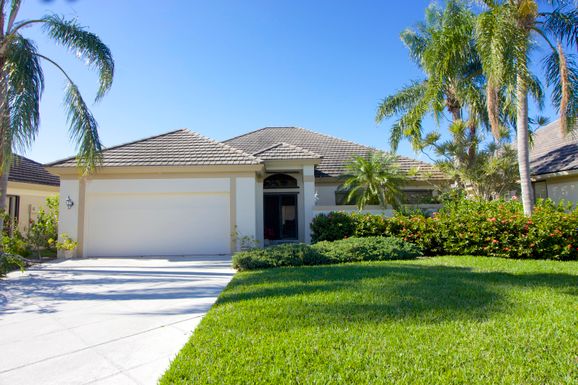
33469, FL Market Trend for Houses
Average List Price
The average list price of houses in 33469, FL, was $3,723,345 in May 2024, compared to $3,252,175 in May 2023.
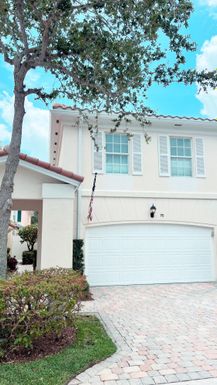
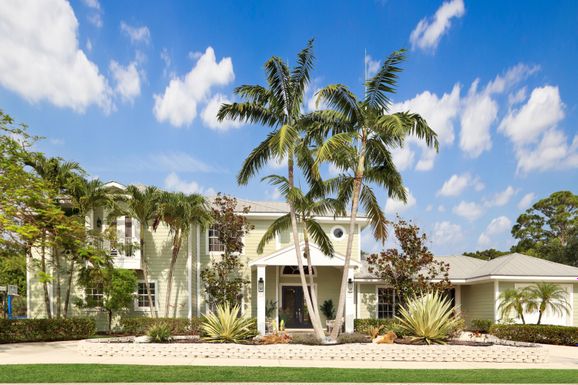
33469, FL Market Trend for Condos / Townhouses / Penthouses
Average List Price
The average list price of condos/co-ops in 33469, FL, was $1,202,877 in May 2024, compared to $1,669,204 in May 2023.
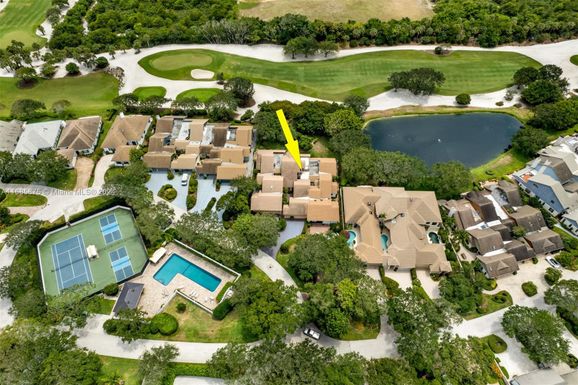
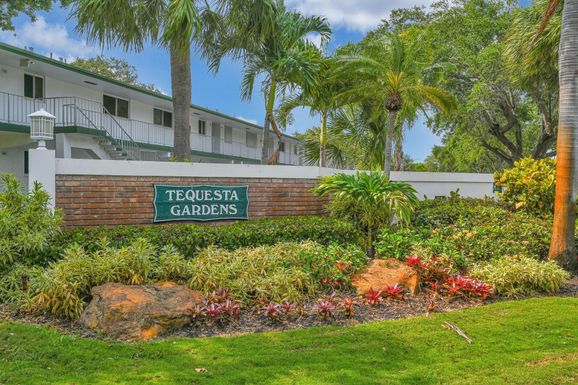
33469, FL Market Trend for Lots/Land
Average List Price
The average list price of lots/land in 33469, FL, was $5,035,000 in May 2024, compared to $2,450,000 in May 2023.
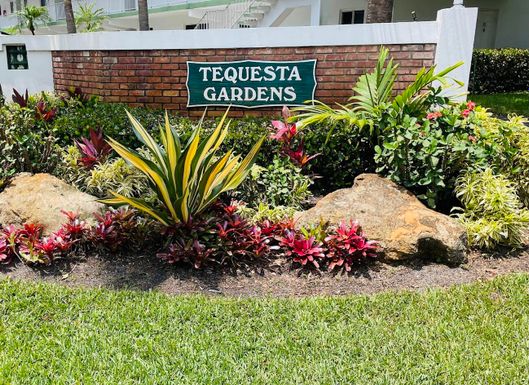
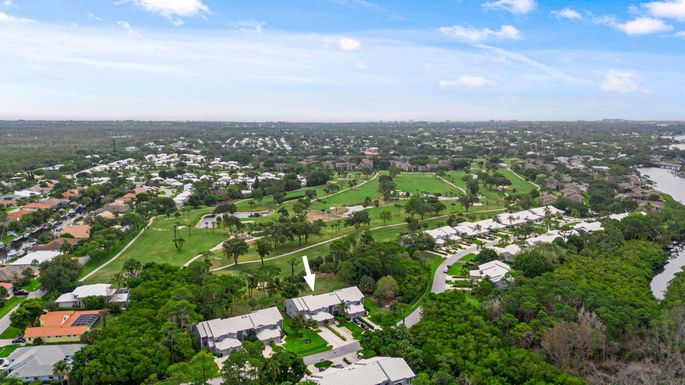
33469, FL Market Trend for Commercial
Average List Price
The average list price of commercial in 33469, FL, was $3,216,479 in May 2024, compared to $4,383,099 in May 2023.
33469, FL Housing Market Analysis
The average list price in 33469, FL is $2,332,447. The average list price in 33469, FL went down 19.80% from 2023 to 2024. 33469, FL home resale inventories is 233, which increased 75.19% since 2023. The average list price per square foot in 33469, FL is $789. 2023 it was $740.