In May 2024, 33043, FL homes were selling for an average price of $745,925, 33043, FL homes on average sell after 140 days on the market compared to 83 days last year. There were 8 homes sold in 33043, FL for May 2024, compared to 9 last year.
The average list price of 33043, FL, was $962,143 in May 2024, compared to $956,175 in May 2023.
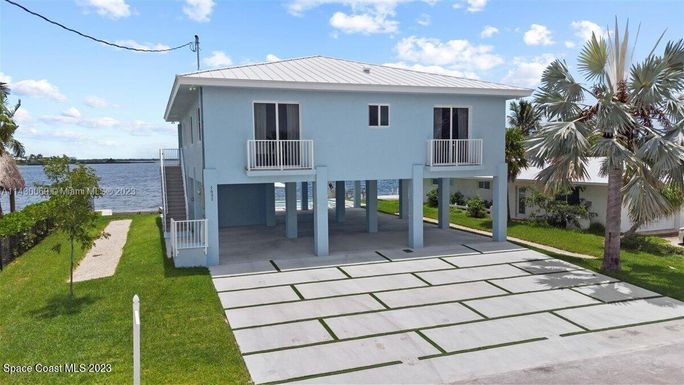
33043, FL Market Trend for Houses
Average List Price
The average list price of houses in 33043, FL, was $2,999,000 in May 2024, compared to $633,880 in May 2023.
33043, FL Market Trend for Condos / Townhouses / Penthouses
Average List Price
The average list price of condos/co-ops in 33043, FL, was $0 in May 2024, compared to $0 in May 2023.
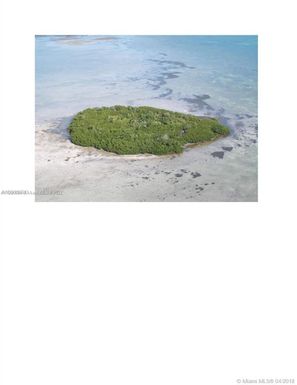
33043, FL Market Trend for Lots/Land
Average List Price
The average list price of lots/land in 33043, FL, was $146,500 in May 2024, compared to $279,999 in May 2023.
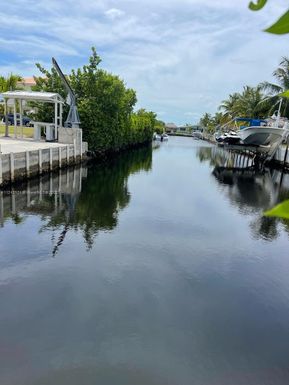
33043, FL Market Trend for Commercial
Average List Price
The average list price of commercial in 33043, FL, was $1,575,000 in May 2024, compared to $2,100,000 in May 2023.
33043, FL Housing Market Analysis
The average list price in 33043, FL is $962,143. The average list price in 33043, FL went down 3.10% from 2023 to 2024. 33043, FL home resale inventories is 7, which stays the same since 2023. The average list price per square foot in 33043, FL is $1,662. 2023 it was $579.