In May 2024, 33035, FL homes were selling for an average price of $377,360, 33035, FL homes on average sell after 49 days on the market compared to 32 days last year. There were 310 homes sold in 33035, FL for May 2024, compared to 402 last year.
The average list price of 33035, FL, was $471,048 in May 2024, compared to $499,252 in May 2023.
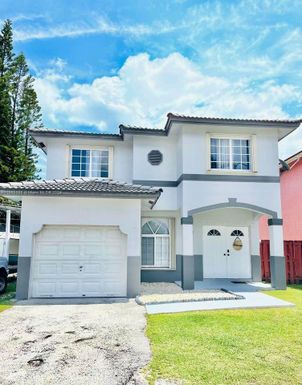
33035, FL Market Trend for Houses
Average List Price
The average list price of houses in 33035, FL, was $549,697 in May 2024, compared to $492,773 in May 2023.
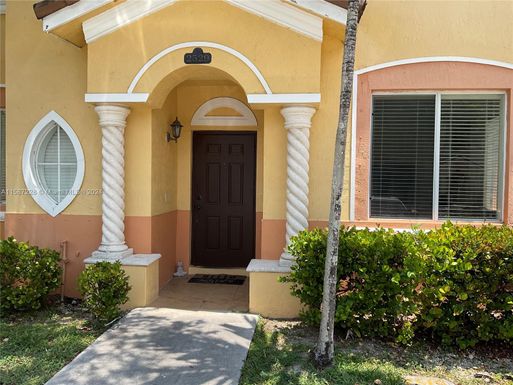
33035, FL Market Trend for Condos / Townhouses / Penthouses
Average List Price
The average list price of condos/co-ops in 33035, FL, was $341,688 in May 2024, compared to $315,620 in May 2023.
33035, FL Market Trend for Lots/Land
Average List Price
The average list price of lots/land in 33035, FL, was $1,180,000 in May 2024, compared to $278,000 in May 2023.
33035, FL Market Trend for Commercial
Average List Price
The average list price of commercial in 33035, FL, was $942,036 in May 2024, compared to $1,144,306 in May 2023.
33035, FL Housing Market Analysis
The average list price in 33035, FL is $471,048. The average list price in 33035, FL went down 6.39% from 2023 to 2024. 33035, FL home resale inventories is 224, which increased 151.69% since 2023. The average list price per square foot in 33035, FL is $261. 2023 it was $255.