In May 2024, 33029, FL homes were selling for an average price of $748,437, 33029, FL homes on average sell after 38 days on the market compared to 36 days last year. There were 504 homes sold in 33029, FL for May 2024, compared to 559 last year.
The average list price of 33029, FL, was $866,639 in May 2024, compared to $726,302 in May 2023.
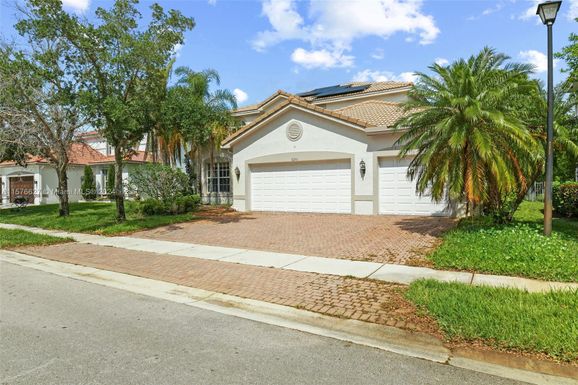
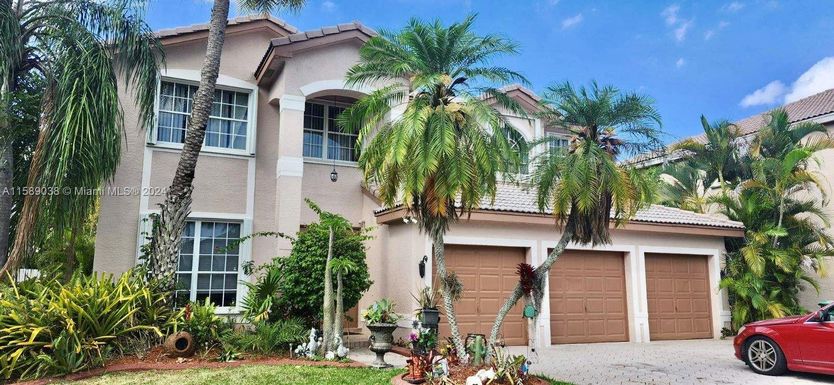
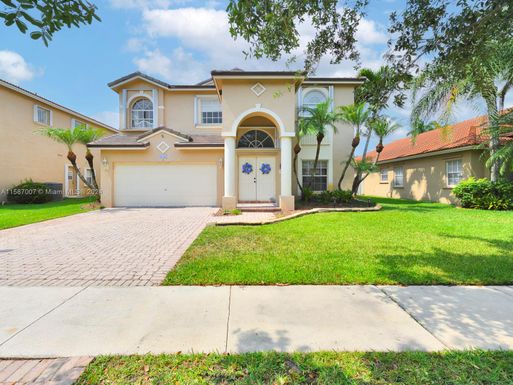
33029, FL Market Trend for Houses
Average List Price
The average list price of houses in 33029, FL, was $919,695 in May 2024, compared to $760,702 in May 2023.
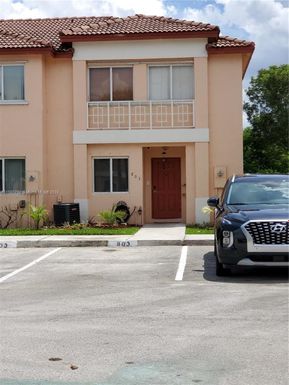
33029, FL Market Trend for Condos / Townhouses / Penthouses
Average List Price
The average list price of condos/co-ops in 33029, FL, was $481,189 in May 2024, compared to $496,225 in May 2023.
33029, FL Market Trend for Lots/Land
Average List Price
The average list price of lots/land in 33029, FL, was $424,900 in May 2024, compared to $123,000 in May 2023.
33029, FL Market Trend for Commercial
Average List Price
The average list price of commercial in 33029, FL, was $610,533 in May 2024, compared to $355,038 in May 2023.
33029, FL Housing Market Analysis
The average list price in 33029, FL is $866,639. The average list price in 33029, FL went up 20.55% from 2023 to 2024. 33029, FL home resale inventories is 128, which increased 18.52% since 2023. The average list price per square foot in 33029, FL is $351. 2023 it was $309.